
Figures & data
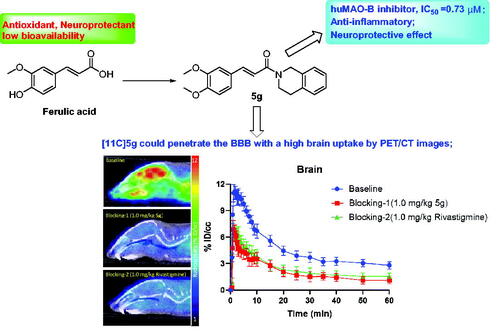
Figure 1. Candidates have reached testing stage in clinical phase II/III trials.
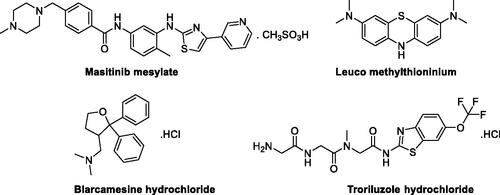
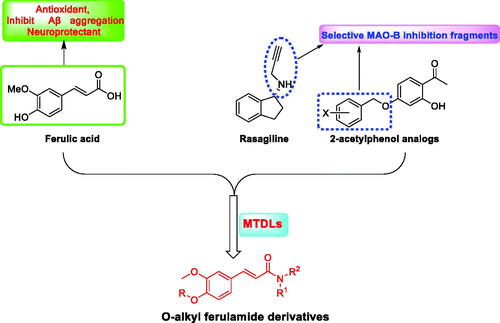
Figure 2. Design strategy of 2-acetylphenol-O-alkylhydroxyethylamine derivatives.
Scheme 1. Synthesis of 5a–5i. Reagents and conditions: (i) CH2Cl2, EDCI, HOBT, room temperature, overnight, yield 40–56%. (ii) RX (4a–4d), K2CO3, CH3CN, 65 °C, 6–10 h, yield 39–76%.
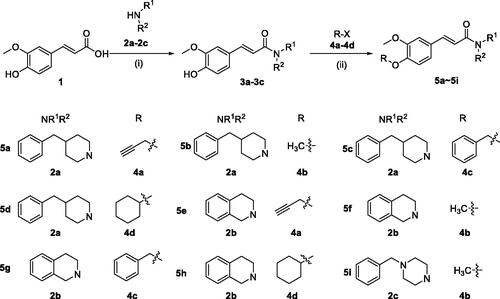
Table 1. Inhibitory activity of MAO-A/MAO-B, antioxidant activity and effects on self-induced Aβ1-42 aggregation by target compounds and positive compounds. 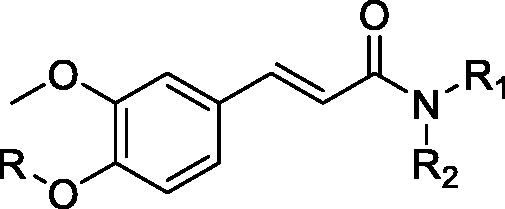
Figure 3. Linewear-Burk plots resulting from the subvelocity curve of the MAO-B activity different substrate concentration in the absence and presence of 5a (0.15, 0.3, and 0.6 μM).
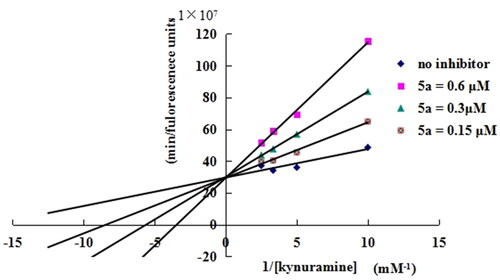
Figure 4. (A) Compound 5a (green stick) interacted with residues in the binding site of hMAO-B (PDB code: 2V60). (B) The selective inhibitor 7-(3-chlorobenzyloxy)-4-carboxaldehyde-coumarin interacted with residues in the binding site of hMAO-B (PDB code: 2V60).
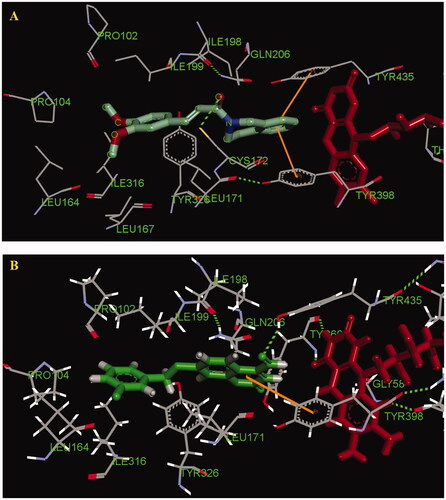
Figure 5. The cell viability of compounds 5a, 5d, 5e, 5f, 5h, and FA on the BV-2 cells were testing using MTT assay. The data were expressed as the mean ± SD through three independent experiments.
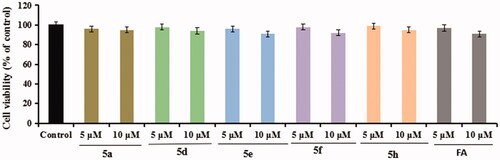
Figure 6. Effects of compounds 5a, 5d, 5e, 5f, 5h, and FA on NO release in BV-2 cells and LPS-stimulated BV-2 cells. Data were expressed as mean ± SD through three independent experiments. con. = control; mod. = model. ##p < 0.01 vs. control; **p < 0.01, *p < 0.05 vs. LPS-induced group.
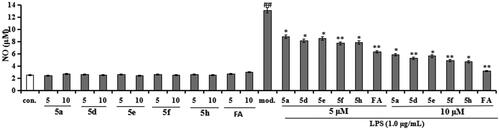
Figure 7. Effects of compounds 5a, 5d, 5e, 5f, 5h, and FA on TNF-α release in LPS-stimulated BV-2 cells. Data were expressed as mean ± SD through three independent experiments. ##p < 0.01 vs. control; ***p < 0.01, **p < 0.01, *p < 0.05 vs. LPS-induced group.
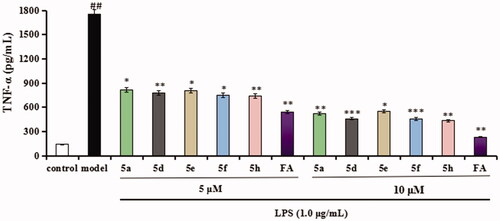
Figure 8. TEM images of Aβ species. (A) inhibition experiments of self-induced Aβ1 − 42 aggregation. (B) disaggregation experiments of self-induced Aβ1 − 42 aggregation.
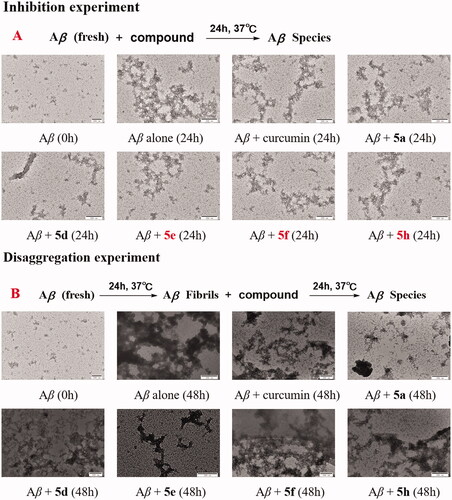
Figure 9. The cell viability (%) of compounds 5a, 5d, 5e, 5f, and 5h on Aβ1-42-induced PC12 cell injury by MTT assay. Percentages of the cell viability were presented as mean ± SD from three independent experiments. ##p < 0.01 vs. untreated group; **p < 0.01, *p < 0.05 vs. Aβ1-42-induced group.
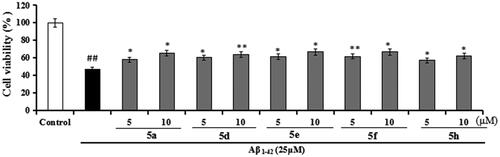
Figure 10. Linear correlation between experimental and reported permeability of commercial drugs using the PAMPA-BBB assay. Pe(exp) = 0.9163, Pe(bibl.) −0.2247 (r2 = 0.9558).
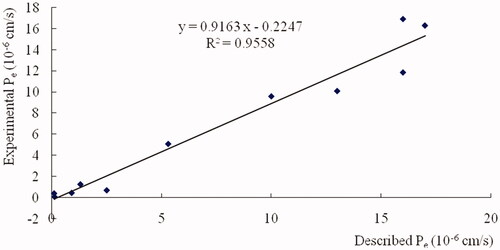
Table 2. Permeability (Pe × 10−6 cm/s) in the PAMPA-BBB assay for 11 commercial drugs used in the experiment validation.
Table 3. The predictive permeation of compounds 5a, 5d, 5e, 5f, and 5h by PAMPA-BBB assay.
Table 4. Theoretical prediction of the druglike properties of compounds 5a, 5d, 5e, 5f, and 5h.
Scheme 2. Radiosynthesis of [11C]5f. Reagents and conditions: NaOH, DMF, 100 °C, 3 min.
![Scheme 2. Radiosynthesis of [11C]5f. Reagents and conditions: NaOH, DMF, 100 °C, 3 min.](/cms/asset/497792a6-9bd6-4022-b4ae-2517d7e68ba5/ienz_a_2073442_sch0002_c.jpg)
Figure 11. PET/CT (baseline and blocking) images in mice brain (20‒60 min) with [11C]5f after intravenous administration (i.v.) and time-activity curve of the whole brain (n = 4).
![Figure 11. PET/CT (baseline and blocking) images in mice brain (20‒60 min) with [11C]5f after intravenous administration (i.v.) and time-activity curve of the whole brain (n = 4).](/cms/asset/16b737c7-c081-4de9-9c0b-da125a11b9e1/ienz_a_2073442_f0011_c.jpg)
Figure 12. Left: the PET/CT imaging of the mice with [11C]5f (whole body, 0–60 min); right: biodistribution of [11C]5f in organs of interest at 5, 15, 30, and 60 min after injection of radioligand (n = 4 for each time point). Error bars represent SEM.
![Figure 12. Left: the PET/CT imaging of the mice with [11C]5f (whole body, 0–60 min); right: biodistribution of [11C]5f in organs of interest at 5, 15, 30, and 60 min after injection of radioligand (n = 4 for each time point). Error bars represent SEM.](/cms/asset/59822864-fab2-4db5-8f43-84e952fdaea7/ienz_a_2073442_f0012_c.jpg)