
Figures & data
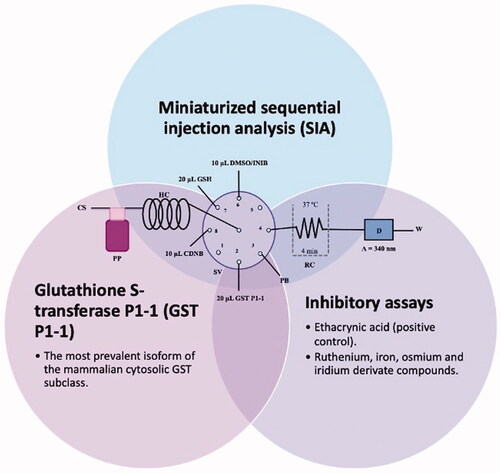
Figure 1. Illustration of the SIA manifold used. CS – Carrier solution; HC – holding coil; PP – peristaltic pump; SV – Selection valve; DMSO/INIB – dimethylsulfoxide/inhibitor; CDNB- 1-Chloro-2,4-dinitrobenzene; GSH – Glutathione reduced; GST P1-1 – Glutathione S-transferase P1-1; PB – Phosphate buffer; RC – Reaction coil; D – Detector and W – Waste.
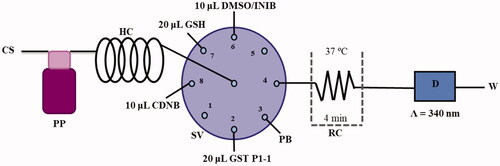
Table 1. Analytical cycle used to perform the GST P1-1 inhibition assays.
Figure 2. GST P1-1 enzymatic reaction.
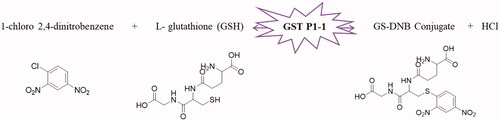
Table 2. SIA system optimisation.
Figure 3. Optimisation of the GST P1-1 reaction time.
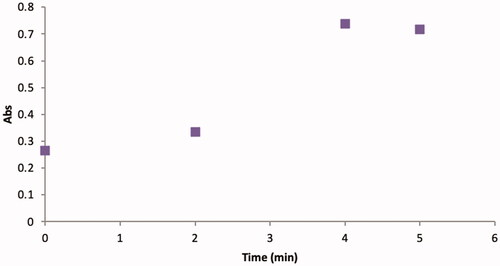
Table 3. Analytical features of the calibration curve.
Table 4. GST P1-1 inhibition of ethacrynic acid and a series of organometallic compounds.
Table 5. Assessment of SIA and batch IC50 values.
Supplemental material