Figures & data
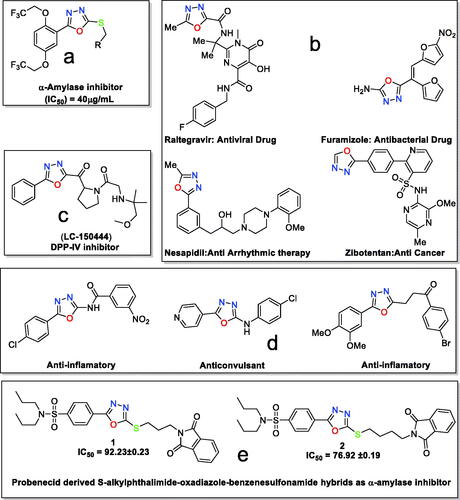
Figure 1. (a) 1,3,4-Oxadizole moiety containing compound as α-amylase inhibitor; (b) 1,3,4-oxadiazole moiety in drugs; (c) 1,3,4-oxadizole moiety containing compound in preclinical trials; (d) 1,3,4-oxdiazole displaying various biological activities; and (e) present work.
Scheme 1. Synthetic approach for probenecid derived three S-alkylphthalimide-oxadiazole-benzenesulfonamide hybrids (1 and 2).
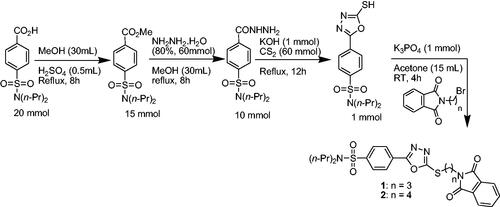
Figure 2. ORTEP diagram of hybrids (a) 1 and (b) 2 that are drawn at a probability level of 40%. Hydrogen atoms are shown by small circles of arbitrary radii. (c) Molecular overlay plot of hybrid 1, molecule I (red) and molecule II (blue). The major of the disordered propyl groups in hybrid 1 are shown for clarity.
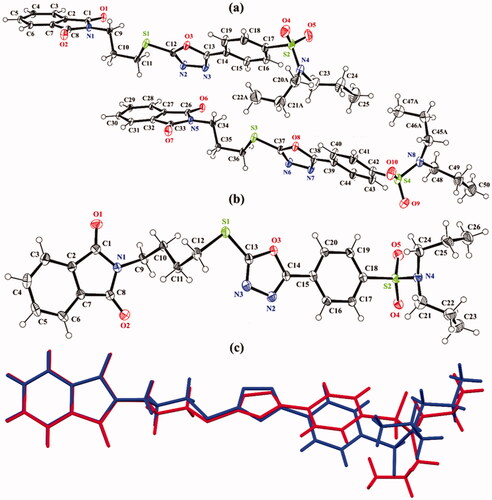
Table 1. X-ray Parameters of both hybrids 1 and 2.
Figure 3. Packing diagram of hybrids (a) 1, and (b) 2. Selected hydrogen atoms are shown for clarity. The major of the disordered propyl groups in hybrid 1 are shown for clarity.
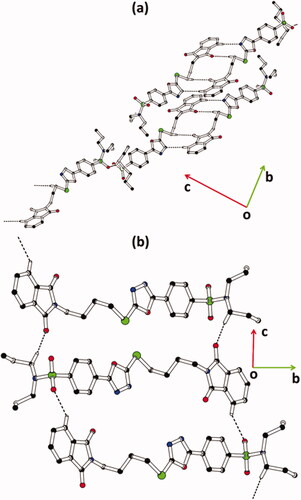
Figure 4. Offset ππ stacking interaction of hybrids (a) 1 and (b) 2. Hydrogen atoms are not shown. The major of the disordered propyl groups in hybrid 1 are shown for clarity. Sulphur atoms S1 and S3 are labelled in order to distinguish between molecules I and II of hybrid 1.
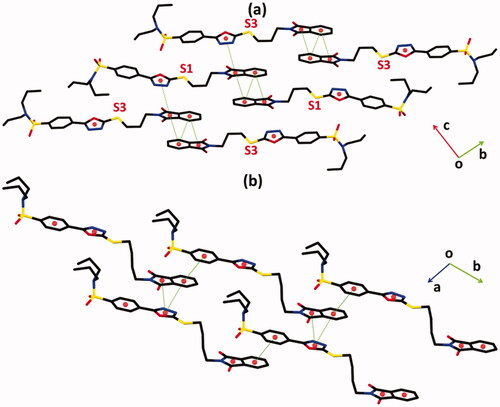
Table 2. Hydrogen-bond geometry (Å, °) for hybrids 1, 2.
Table 3. The important parameters of offset ππ stacking interactions in hybrids 1 and 2.
Figure 5. Molecular electrostatic potential (MEP) maps of hybrids (a) 1 and (b) 2 are plotted onto 0.002 au electron density contours. The electrostatic potential varies from −0.01 (red) to +0.01 (blue) au.
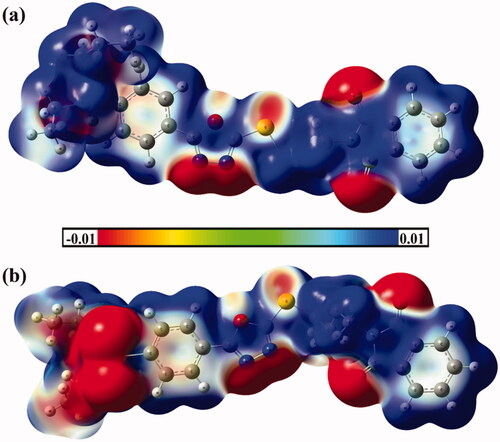
Figure 6. Frontier molecular orbitals (FMOs), including the highest occupied molecular orbitals (HOMO) and lowest unoccupied molecular orbitals (LUMO) of hybrids (a) 1 and (b) 2.
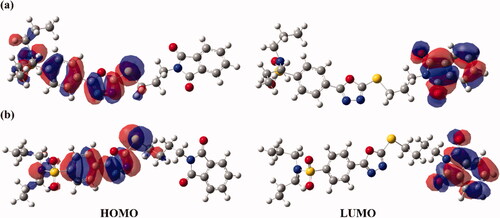
Figure 7. Quantum theory of atoms in molecules (QTAIM) and 3 D noncovalent interaction (NCI) isosurfaces of hybrids (a) 1 and (b) 2. The isosurfaces are generated with a reduced density gradient value of 0.50 au and coloured from blue to red according to sign(λ2)ρ ranging from −0.035 (blue) to 0.020 (red) au.
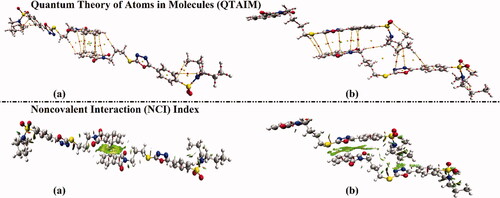
Figure 8. View of the Hirshfeld surfaces mapped over dnorm property of (a) hybrid 1 and (b) hybrid 2. The labels 1, 2, 3, and 4 represent N···H/H···N, O···H/H···O, C···H/H···C, and S···H/H···S interactions, respectively.
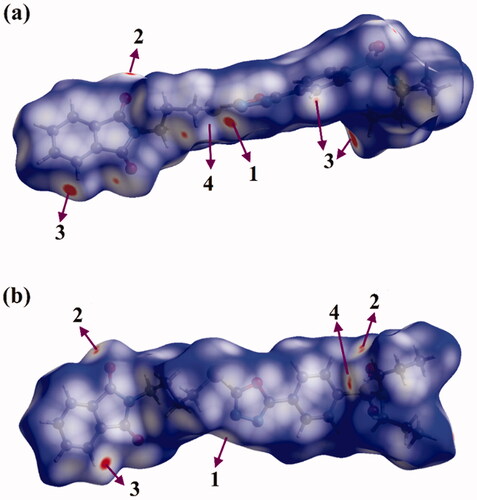
Figure 9. 2 D fingerprint plots of hybrids (a) 1 and (b) 2.
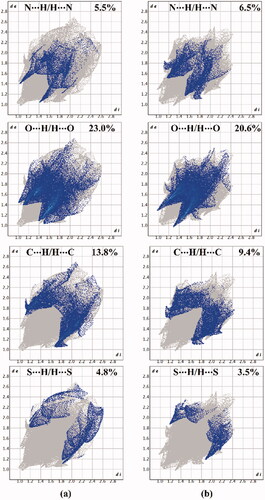
Figure 10. Hirshfeld surfaces of hybrids (a) 1 and (b) 2 mapped over Shape index and Curvedness properties.
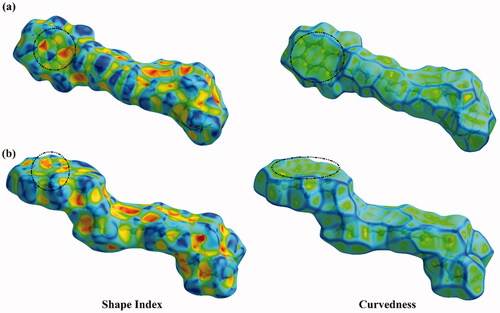
Figure 11. Graphical representation of α-amylase inhibition of probenecid derived two S-alkylphthalimide-oxadiazole-benzenesulfonamide hybrids (1 and 2) at different concentrations.
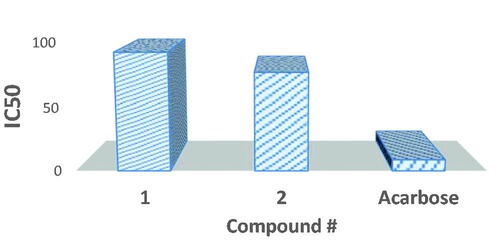
Table 4. α-Amylase inhibition values of probenecid derived two S-alkylphthalimide-oxadiazole-benzenesulfonamide hybrids (1 and 2).
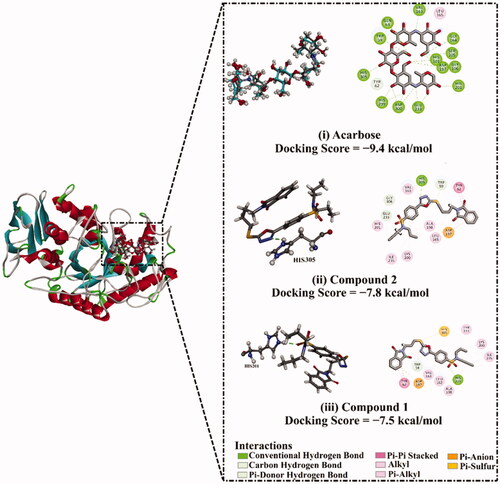
Figure 12. (i) 3D and 2D representations of the anticipated docking pose (in cyan) and experimental structure (in gray) of acarbose and the predicted binding modes of compounds (ii) 2, and (iii) 1 with α-amylase.