
Figures & data
Figure 1. Design of the target benzoxazole-benzamide conjugates 1–15.
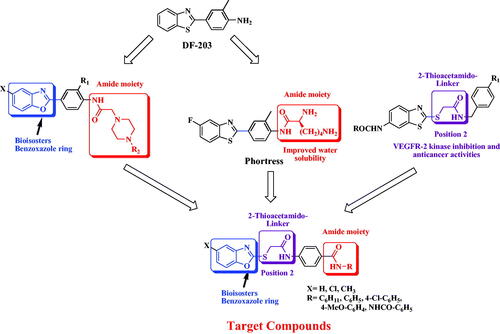
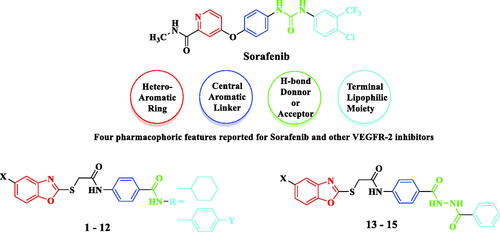
Figure 2. Target benzoxazoles fulfilled the pharmacophoric structural features of VEGFR-2 inhibitors.
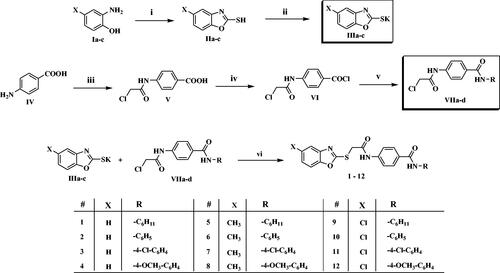
Scheme 1 Synthesis of the compounds 1–12; Reagents/conditions: (i) CS2/KOH/CH3OH/reflux 6 h, (ii) KOH/C2H5OH/reflux 4 h, (iii) ClCH2COCl, NaHCO3/DMF/r.t./1h, (iv) SOCl2/1,2-dichloroethane/reflux 4 h, (v) R-NH2/acetonitrile/TEA/r.t. 8 h, (vi) DMF/KI/60 °C/6h.
Scheme 2. Synthesis of the compounds 13–15; Reagents/conditions: (i) CH3OH/conc. H2SO4/reflux 2 h, (ii) NH2-NH2/C2H5OH/reflux 4 h, (iii) acetonitrile/TEA/r.t. 8 h, (vi) DMF/KI/60 °C/6h.
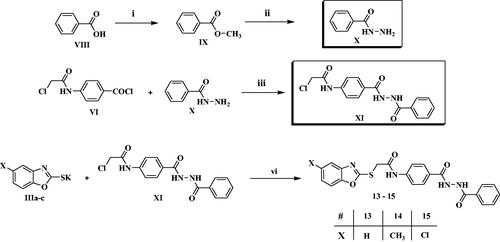
Figure 3. In vitro anti-proliferative activity of the target compounds 1–15.
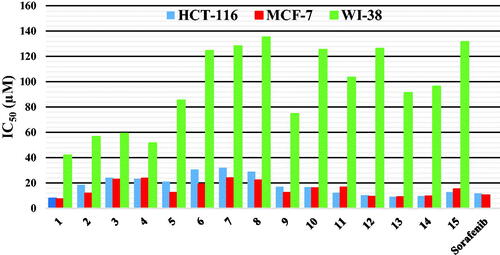
Table 1. In vitro anti-proliferative activity of the compounds 1–15 against HCT-116, MCF-7 human cancer cell lines and W-180 normal cell line, and their corresponding selectivity indices.
Figure 4. Inhibitory activity of 1, 9, 10, 11, 12 and 15 against VEGR-2 Protein Kinase.
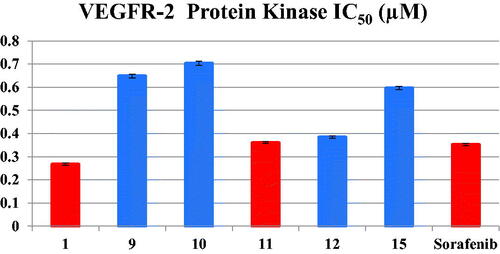
Table 2. Inhibitory activity of 1, 9, 10, 11, 12 and 15 against VEGR-2 Protein Kinase.
Figure 5. Cell distribution in the subG1, G0/G1, S and G2/M phases for HCT116 cells (B) treated with vehicle control (A), compounds 1 (C) and 11 (D).
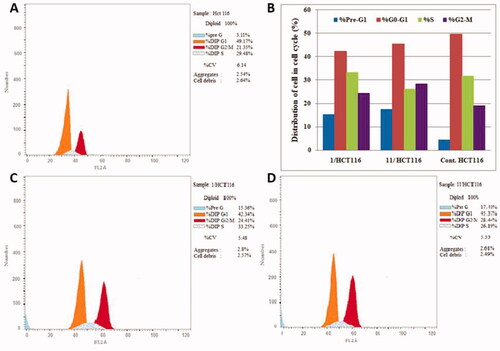
Figure 6. Cell distribution in the subG1, G0/G1, S and G2/M phases for MCF7 cells (B) treated with vehicle control (A), compounds 1 (C) and 11 (D).
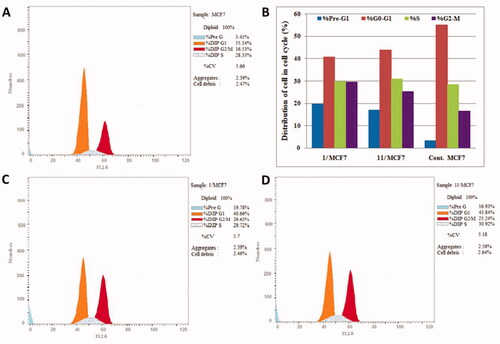
Table 3. Effect of compounds 1, 11 and vehicle control on the cell cycle phases of HCT-116 and MCF-7 cells lines.
Figure 7. Effect of compounds 1, 11 and vehicle control on the percentage of annexin V-FITC-positive staining in HCT-116 cell line. The experiments were done in triplicates. The four quadrants identified as: LL, viable; LR, early apoptotic; UR, late apoptotic; UL, necrotic.
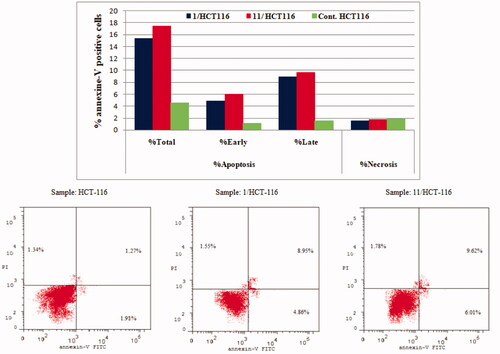
Figure 8. Effect of compounds 1, 11 and vehicle control on the percentage of annexin V-FITC-positive staining in MCF-7 cell lines. The experiments were done in triplicates.
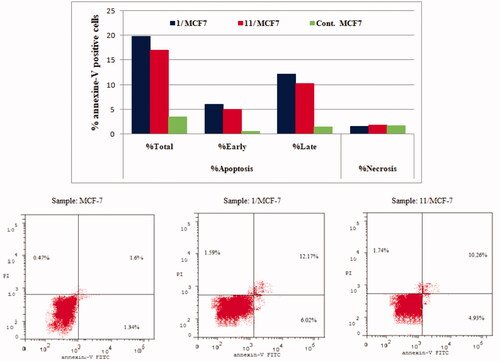
Table 4. Percent of apoptosis and necrosis induced by compounds 1, 11 and vehicle control in HCT-116 and MCF-7 cell lines.
Figure 9. Effect of compounds 1, 11 and vehicle control on anti-apoptotic proteins (Bcl-2 and Bcl-xL) in (A) HCT-116 cancer cells and (B) MCF-7 cancer cells.
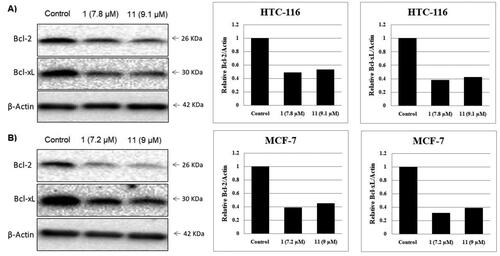
Figure 10. Docking of compounds 1, 11 and sorafenib into the VEGFR active site. (A) Interaction of Sorafenib with amino-acids Leu840, Glu885, Lys920 and Asp1046. (B) Interaction of 1 with amino-acids Leu840, Lys868, Cys919, Asp1046 and Phe1047 and superimposition of 1 (shown as cyan sticks) with sorafenib (shown as green sticks). (C) Interaction of 11 with amino-acids Lys868 and Asp1046 and superimposition of 11 (shown as cyan sticks) with sorafenib (shown as green sticks).
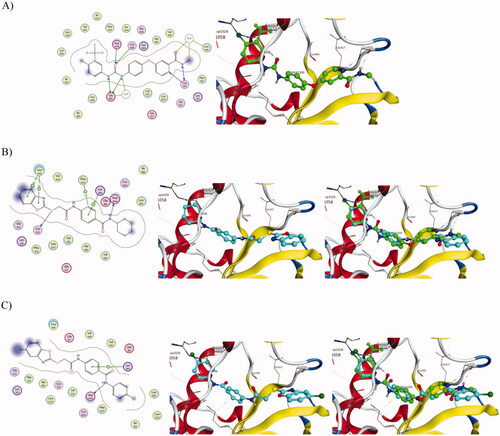
Table 5. Docking energy scores (kcal/mol) obtained from the MOE software for compounds 1–15 and sorafenib.