Figures & data
Figure 1. Structures of Staurosporine and its simplified derivatives, which have entered clinical trials as kinase inhibitors, and Caulersin.
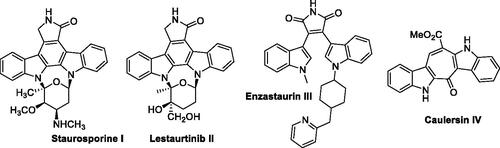
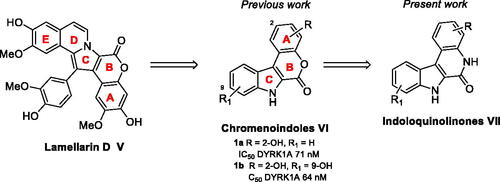
Figure 2. Lamellarin D, chromenoindoles, and envisioned indoloquinolinone chemical series.
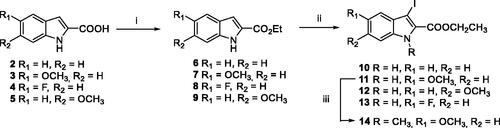
Scheme 1. Reagents and conditions: (i) EtOH, conc. H2SO4 10 mol%, reflux, 12 h, 6–9 quant.; (ii) I2 (1.5 equiv.), KOH (4.0 equiv.), DMF, r.t., 4 h; (iii) NaH (1.5 equiv.), CH3I (1.2 equiv.), DMF, 0–20 °C.
Scheme 2. Reagents and conditions: (i) PhMgCl 2 M in THF (1.2 equiv.), B(OCH3)3 (1.2 equiv.), 30 min. at -78 °C, then aq. HCl 2 M at -10 °C, 10 min; (ii) PdCl2(dppf) (0.03 equiv.), KOAc (2.0 equiv.), Bis-(pinacolato)diboron (1.5 equiv.), 1,4-dioxane/H2O 10/1, 80 °C, 14 h.
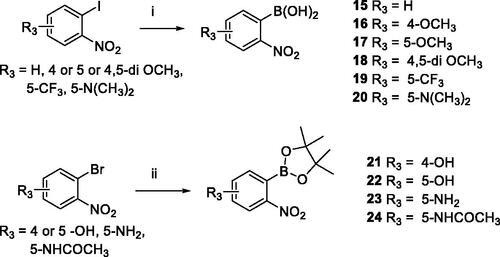
Table 1. Suzuki-Miyaura reaction using 10–14 and boronylated derivatives 15–24. 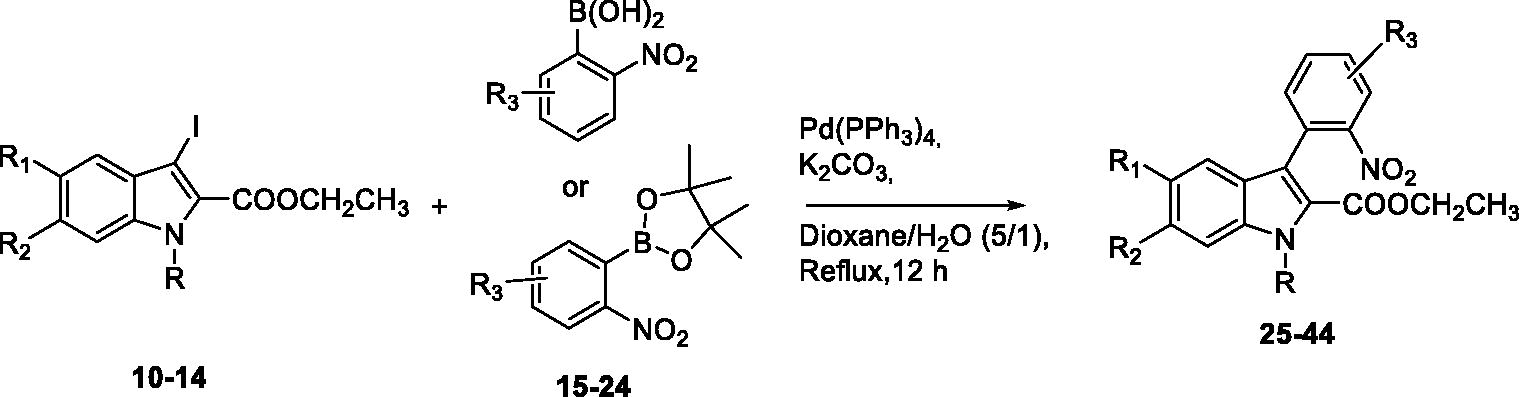
Table 2. “One pot” reduction of nitro group and lactam formation of derivatives 25–44 leading to final compounds 45–64. 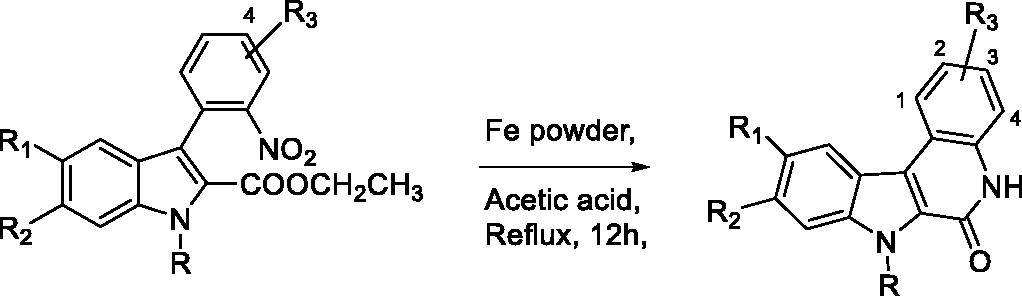
Table 3. Residual activity on a representative panel of 8 protein kinases at 1 μM.
Table 4. Measured IC50 values (nM) on Haspin, CLK1 and DYRK1A.
Table 5. Effects on cell viability, EC50 on RPE1 and U-2 OS cell linesa.
Figure 3. Selectivity profile of compound 55 evaluated on 486 kinases at 1 μM in duplicate (SelectScreen Whole Panel, Life Technologies) and represented on a dendrogram (courtesy of Cell Signalling Technology). Kinases whose activities are inhibited by 80% and above are shown as dots, Haspin is visualised as a green dot, CLKs as purple dots and DYRKs as orange dots.
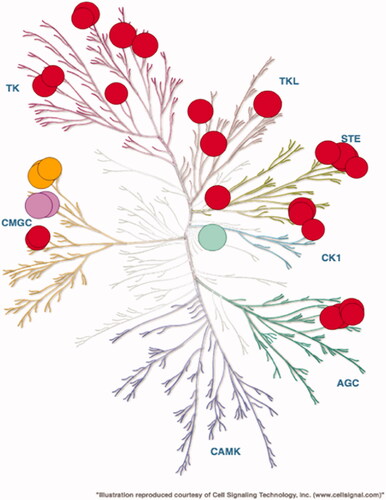
Figure 4. Superimposition of the ATP site of the three protein kinases, CLK1, DYRK1A and Haspin (residues and ribbons are coloured regarding their localisation in the kinase structure: hinge region (yellow), DFG motif (cyan), G loop (green), Catalytic K (orange), αC-helix (purple) and HRD region (red)), drawn with MOE software.Citation24 Non-polar hydrogen atoms are hidden for clarity. Catalytic lysine and residues in the hinge region forming hydrogen bonds with the ligand are highlighted. CLK1: Leu244 and Lys191, DYRK1A: Leu241 and Lys188, and Haspin: Gly608, Gly609 and Lys 511.
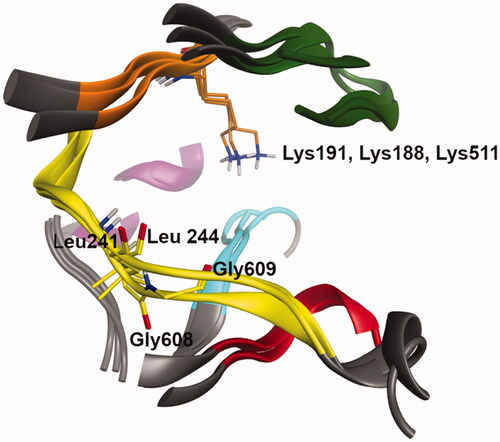
Figure 5. Binding mode representation of 49 (green) and 62 (purple) in ATP site of Haspin. Hydrogen bond interactions are represented in dashed lines.
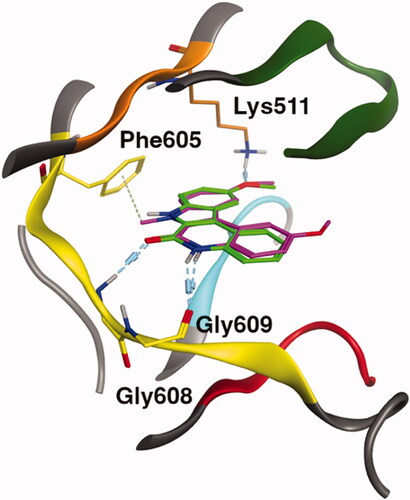
Figure 6. Effects of compounds on cell viability. Cell viability was assessed on the following human cell lines: U-2 OS (osteosarcoma), HCT116 (colorectal cancer), MDA-MB231 (breast cancer), SH-SY5Y (neuroblastoma) and RPE-1 (retinal fibroblast immortalised with hTERT). Cells were incubated with 25 μM of selected compounds or 10 μM of staurosporine or 0.1% of DMSO for 48 h. Cell viability was evaluated in triplicate via MST assay and results expressed as percentage of DMSO control (mean set at 100%). Results on graphs are mean ± SD.
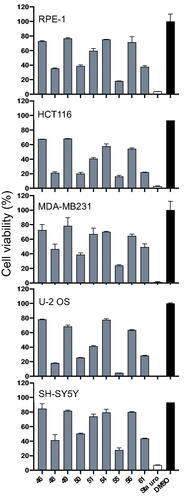
Figure 7. Effects of compounds on U-2 OS and HCT116 spheroid viability. Cell viability in spheroids from U-2 OS and HCT116 cells was measured after 7 days of treatment with DMSO (0.5%), CHR6494 (CHR), SBS018 or Cpd55 at a single dose of 2.5, 5, and 10 µM, on day 0. Cell viability is expressed in percentage of the DMSO control. n = 3, results are mean ± s.e.m.
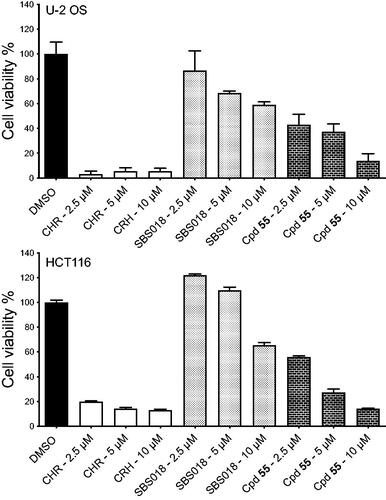
Figure 8. Cellular endogenous Haspin inhibition. U-2 OS cells were treated for 16 h with 0.5 µM of each compound or 0.1% of DMSO (CHR: CHR-6494). Haspin activity was monitored by immunofluorescence staining of phosphorylated Histone H3 on threonine 3 (H3T3ph, green); α-Tubulin was visualised in red and DNA was stained by DAPI (blue). Haspin activity was quantified in prometaphase/metaphase cells measuring the H3T3ph and DAPI signals and representing the H3T3ph/DAPI ratio on a scatter plot (upper panel). The inserted dot plot allows the comparison of the 3 tested compounds on a more precise scale; n ≥ 15, *p ≤ 0.05; **p ≤ 0.01 (two-tailed unpaired t-test). Representative images are presented on the lower panel, Bar 5 µm.
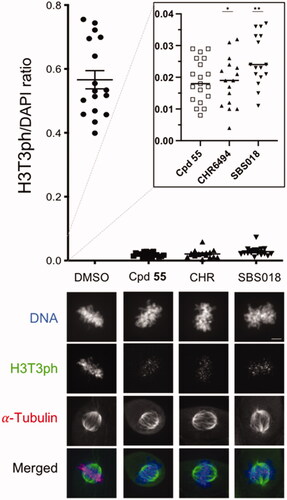
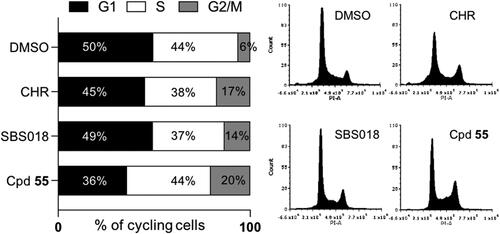
Figure 9. Effect of compounds on the cell cycle. U-2 OS cells were treated for 24 h with 1 µM of each compound or 0.2% DMSO (CHR: CHR-6494). DNA content was measured by flow cytometry and the percentages of cells in each phase of the cell cycle is represented on a proportional bar graph. Representative profiles for each treatment are shown on the right panels.