
Figures & data
Table 1. Clinical characteristics of CRC patients.
Figure 1. Protonography of whole lymphocyte extracts prepared from tumour and adjacent healthy tissues as well as from peripheral blood of a patient with intestinal adenocarcinoma included in this study. The gel was run under denaturing but non-reducing conditions. Protonography showed a yellow band migrating with a rough molecular mass of about 26 kDa, which corresponds to the hydratase activity. Legend: Lane Std, molecular markers (from bottom to the top: 25 kDa, 37 kDa, 50 kDa, and others); lane 1, commercial bovine CA used as positive control; lane 2, lymphocyte collected from the tumour tissue; lane 3, lymphocyte collected from adjacent healthy tissues; lane 4, lymphocyte collected by PBMCs.
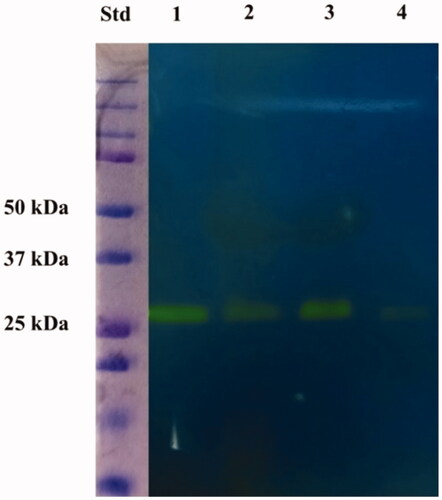
Table 2. Protein identification details of gel portions associated with CO2 hydratase activity through protonography.