Figures & data
Figure 1. Design strategy of PDEδ probes by molecular docking study. (A) The chemical structures of Deltarasin and indolizino[3,2-c]quinoline (IQ) scaffold; (B) Superimposition of farnesyl (magenta), Deltarasin (green) and PD3 (white) in the prenyl binding site of PDEδ. Farnesyl: obtained from a cocrystal complex with PDEδ (PDB: 3T5G), deltarasin: obtained from a cocrystal complex with PDEδ (PDB: 4JV8), PD3: obtained from a docking result in this study; (C) Predicted binding mode of PD3 in the prenyl binding site of PDEδ. The surface of the PDEδ binding site was generated by hydrophobicity. Colour spectrum: the hydrophobic regions in brown and the hydrophilic ones in blue.
![Figure 1. Design strategy of PDEδ probes by molecular docking study. (A) The chemical structures of Deltarasin and indolizino[3,2-c]quinoline (IQ) scaffold; (B) Superimposition of farnesyl (magenta), Deltarasin (green) and PD3 (white) in the prenyl binding site of PDEδ. Farnesyl: obtained from a cocrystal complex with PDEδ (PDB: 3T5G), deltarasin: obtained from a cocrystal complex with PDEδ (PDB: 4JV8), PD3: obtained from a docking result in this study; (C) Predicted binding mode of PD3 in the prenyl binding site of PDEδ. The surface of the PDEδ binding site was generated by hydrophobicity. Colour spectrum: the hydrophobic regions in brown and the hydrophilic ones in blue.](/cms/asset/6d60ec83-18e0-4f72-acab-6a997f12a584/ienz_a_2086865_f0001_c.jpg)
Figure 2. Representative emission spectra of PD1 (A) and PD3 (B). All emission spectra were taken in 20 mM Tris buffer (pH 7.5) at Ex 280 nm. Red dotted line: 2 μM PDE δ, blue line: 2 μM PD, green line: 2 μM PDE δ after incubation with 2 μM PD. Although the curve of PD3 (B) was saturated, it was necessary to compare the binding abilities of each PD compound in the same condition as the initial screen.
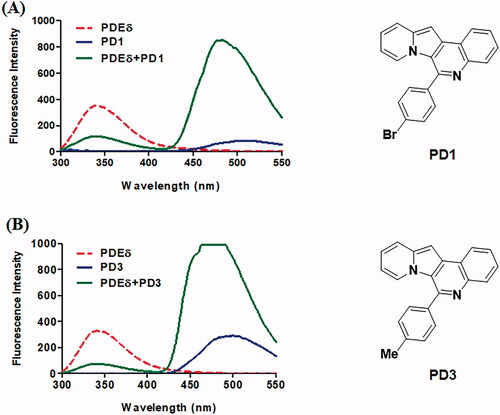
Figure 3. Binding affinities of PDs measured by fluorescence polarisation. (A) Representative binding curve of PDs (PD3) titrated with PDEδ. The FP value was measured in PBS buffer (pH 7.2) containing 8 concentrations (0, 0.5, 1, 2, 4, 8, 16 and 32 μM) of PDEδ mixed with 0.5 μM PDs. Ex: 440 nm, Em: 526 nm; (B) Kd value and half-life of each compound; (C, D) Kinetic trace of PD3 and PD7 in the competition assay. PD3 was shown as a compound with the longest retention time (slow dissociation), whereas PD7 was shown as a compound with the shortest retention time (fast dissociation). The half-life was obtained by a competition binding assay using excess deltarasin. The optimal concentration of PDEδ for the competition assay was determined using the Kd value and PD concentration (0.5 μM) for making more than 68% of the binding complex. Ex: 430 nm, Em: 520 nm.
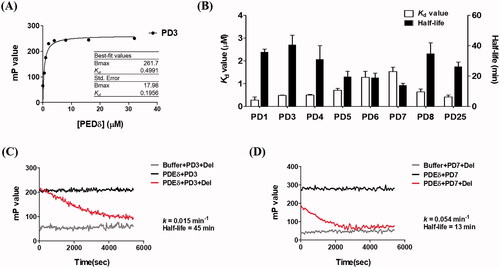
Table 1. Optical properties of PDs along with binding parameters to PDEδ. 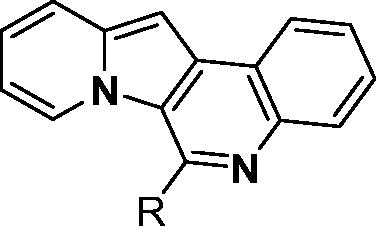
Figure 4. Evaluation of target specificity. (A) SDS–PAGE of fraction samples during the purification of PDEδ protein. Sol: Soluble, FT: Flow through, W1: Washing 1, WF: Washing final, M: Marker, E1–5: Elution 1-5, PDEδ: 20 kDa; (B) Fluorescence image of mixture of PD3 and fraction samples on 96-well plate (Ex. 312 nm). Lane 1: 0.5 mM PD3. Lane 2: 0.1 mM PD3. (C) Top: fluorescence image of a 12% Native gel. Fluorescence was measured by ImageQuantTM LAS 4000 with a 605DF40 EtBr filter (Ex. 312 nm). Lane 1: lysate with DMSO, Lane 2: lysate with 5 µM PD3, Lane 3: lysate with 50 µM PD3, M: marker, Lane 4: purified PDEδ with DMSO, Lane 5: purified PDEδ with 5 µM PD3, Lane 6: purified PDEδ with 50 µM PD3. Bottom: band intensity of fluorescence image. (D) Coomassie staining of the same 12% native gel.
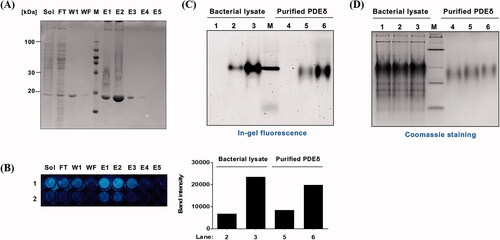
Figure 5. Affinity pull-down assay of bacterial lysate (PDEδ overexpressed) with PD3-B. NeutrAvidin resin was incubated with PD3-B (100 μM) followed by bacterial lysate (150 μg) in PBS buffer. Then, bound proteins were eluted by adding elution buffer (2% SDS in PBS) at room temperature. The eluted samples were subjected to SDS–PAGE (18% polyacrylamide gel). The gels were stained with colloidal Coomassie brilliant blue solution. (A) Colloidal CBB staining of SDS–PAGE gel. Lys: bacterial lysate, FT: flow through in step 1. W: washing sample in step 1, E1: elution sample in step 2. PDEδ: 20 kDa; (B) Concentration-dependent pull down of bacterial lysate by PD3-B.
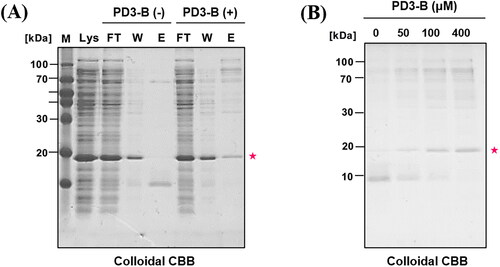
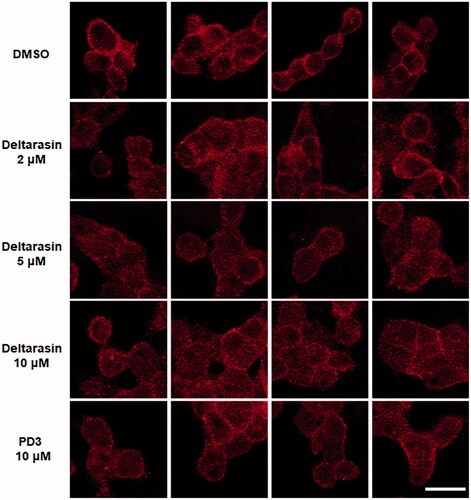
Figure 6. Immunofluorescence of PANC-1 cells with an anti-Pan-RAS antibody (red). DMSO was used as a negative control, and deltarasin was used as a positive control. Ex: 633 nm, Em: ≥638 nm. The scale bar represents 20 µm.