
Figures & data
Figure 1. Structures of active drugs containing fused pyrimidine (I) Roscovitine, (II) Ibrutinib, and (III) Dinaciclib, Reported pyrazolo[3,4-d]pyrimidines derivatives (IV), (V), and (VI), and Reported pyrazolo[1,5-a]pyrimidines derivative (VII) as CDK2 inhibitors.
![Figure 1. Structures of active drugs containing fused pyrimidine (I) Roscovitine, (II) Ibrutinib, and (III) Dinaciclib, Reported pyrazolo[3,4-d]pyrimidines derivatives (IV), (V), and (VI), and Reported pyrazolo[1,5-a]pyrimidines derivative (VII) as CDK2 inhibitors.](/cms/asset/98e46170-6934-4fe6-abca-322230013f03/ienz_a_2086866_f0001_b.jpg)
Figure 2. Binding mode schematic illustration of Roscovitine ligand (I) (A) and Newly synthesised pyrazolopyrimidine derivative compound 13 (B) with key amino acids at CDK2 binding site.
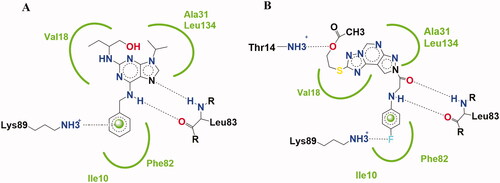
Figure 3. Features' similarities between Roscovitine ligand (I) and reported pyrazolo[1,5-a]pyrimidines derivative (VII) against the newly designed compounds as potent CDk2 inhibitors.
![Figure 3. Features' similarities between Roscovitine ligand (I) and reported pyrazolo[1,5-a]pyrimidines derivative (VII) against the newly designed compounds as potent CDk2 inhibitors.](/cms/asset/fd07e08e-1f7f-4b29-85fd-4929654f33bf/ienz_a_2086866_f0003_c.jpg)
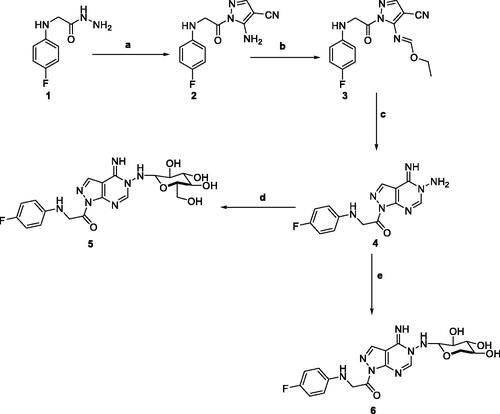
Scheme 1. Reagents and conditions; (a) 2-(ethoxymethylene)-malononitrile, EtOH, reflux, 6 h. (b) triethyl orthoformate, acetic anhydride, reflux, 6 h. (c) hydrazine hydrate, EtOH, reflux, 6 h. (d) D-Glucose, EtOH, glacial acetic acid, reflux, 3 h. (e) D-Xylose, EtOH, glacial acetic acid, reflux, 3 h.
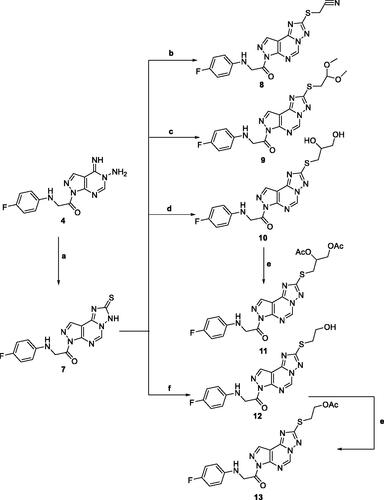
Scheme 2. Reagents and condition; (a) CS2, KOH, EtOH, reflux, 6 h. (b) Chloroacetonitrile, K2CO3, DMF, 25 °C, 8 h. (c) Chloroacetaldhyde dimethyl acetal, K2CO3, DMF, 25 °C, 8 h. (d) 2-chloro-1,2-propandiol, KOH, EtOH, reflux, 3 h. (e) Acetic anhydride, pyridine, reflux, 2 h. (f) 2-chloroethanol, KOH, EtOH, reflux, 3 h.
Scheme 3. Reagents and conditions; (a) 2,3,4,6-Tetra-O-acetyl-D-glucopyranosylbromide, KOH, acetone, 25 °C, 6 h. (b) 2,3,4,6-Tetra-O-acetyl-D-glactopyranosylbromide, KOH, acetone, 25 °C, 6 h.
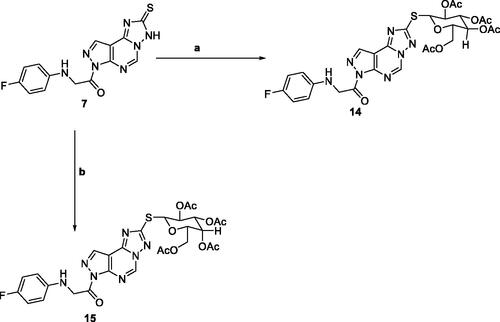
Figure 4. The IC50 of tested compounds against MCF-7, HepG-2, and HCT-116 cancer cell lines. Data expressed as mean ± SD from three independent repeats (n = 3). *Significant from sorafenib at p < 0.05.
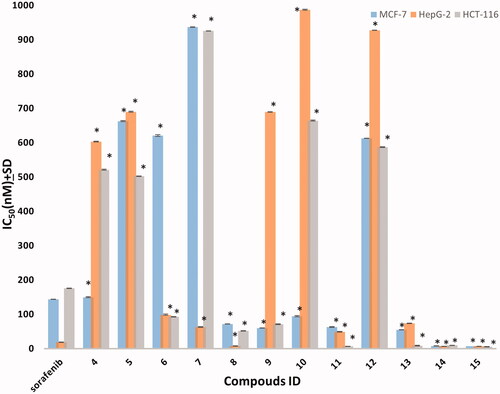
Table 1. The In vitro anti-proliferative activity of the synthesised compounds against human cell lines.
Figure 5. Inhibitory activity of most potent compounds on CDK/Cyclin A2. *Significant from sorafenib at P < 0.05, # Significant from dinaciclib at P < 0.05.
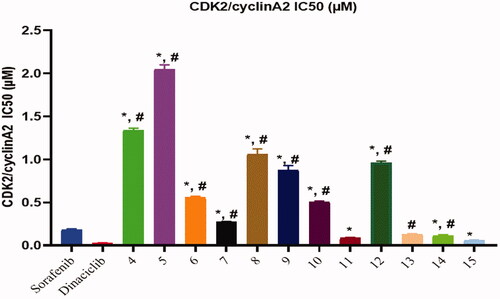
Table 2. CDK2/cyclin A2 inhibitory activity results of all synthesised compounds.
Table 3. The In vitro cytotoxicity of the most active compound 15 and Staurosporine against normal lung cells (WI-38).
Figure 6. Flow cytometric analysis for cell cycle distribution. (A) Control HCT, (B) Compound 15, and (C) graphical representation for cell cycle distribution analysis among differently treated cells.
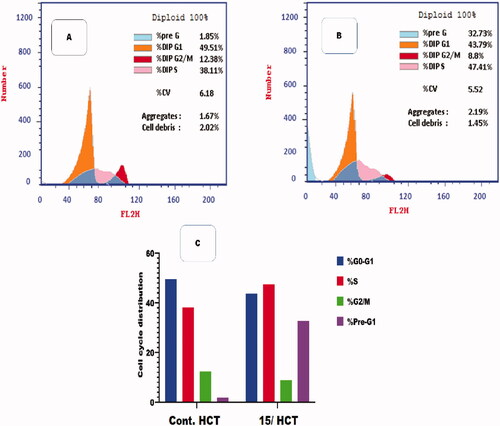
Table 4. Flow cytometric analysis for cell cycle distribution of compound 15 on HCT-116 cells.
Figure 7. Flow cytometric analysis of apoptosis among treated cells. (A) Control HCT, (B) Compound 15, and (C) Graphical illustration of apoptosis % among differently treated cells.
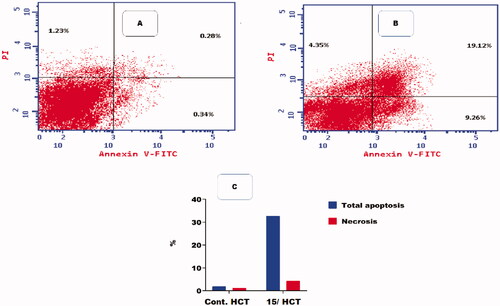
Table 5. Effect of compound 15 on apoptosis in HCT-116 cells.
Figure 8. The superimposition 3D diagram of co-crystallised (green colour) and ligand after docking (purple colour) at the active site.
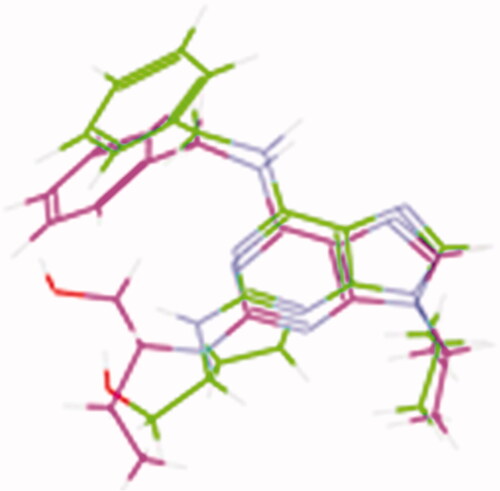
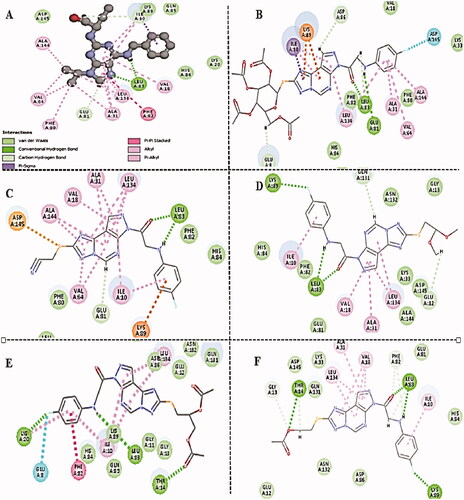
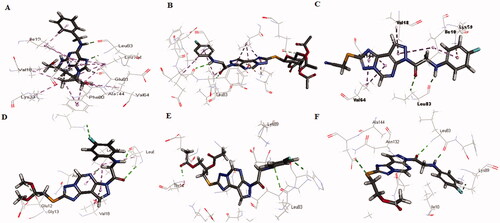
Table 6. In silico ADMET predictions of the newly synthesised compounds using Discovery Studio.
Table 7. Physicochemical properties predictions of the most potent promising compounds using ADMETlab.
Table 8. ADMETlab absorption, distribution, and excretion parameters of the most potent compounds with promising docking results.
Figure 10. The common physicochemical properties of compounds (A) Roscovitine, (B) Compound 15.
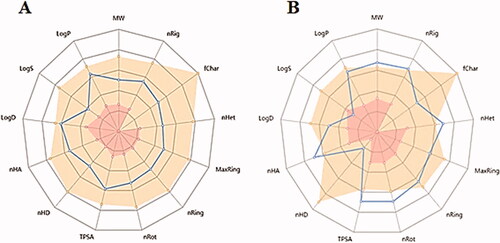
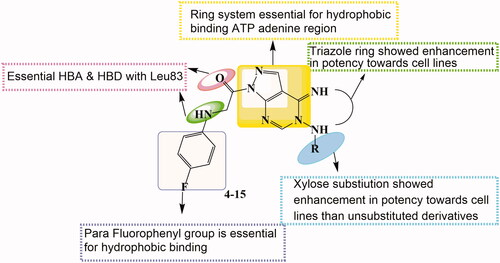
Figure 11. Structure–activity relationship for compounds (4–15).
Supplemental Material
Download PDF (2.1 MB)Data availability statement
Supporting data is supplied with the manuscript.