Figures & data
Figure 1. (A) Drugs approved by FDA and NMPA for the treatment of AD by June 2021; (B) Representative GSK-3β inhibitors with anti-AD activity in vivo.
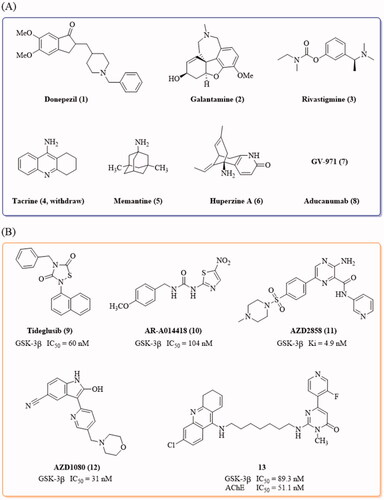
Figure 2. Design of thieno[3,2-c]pyrazol-3-amine derivatives as GSK-3β inhibitors.
![Figure 2. Design of thieno[3,2-c]pyrazol-3-amine derivatives as GSK-3β inhibitors.](/cms/asset/6c0a9c8f-cce3-4369-821a-a283223df1b9/ienz_a_2086867_f0002_c.jpg)
Scheme 1. Synthesis of thieno[3,2-c]pyrazol-3-amine derivatives 16a–16e, 17a–17d and 18a–18n. Reagents and conditions: (a) various acyl chlorides or propane-1-sulphonyl chloride, pyridine, 110 °C; (b) substituted arylboronic acids or arylboronic acid esters, Pd(dppf)Cl2, CH3CO2K, DMF/EtOH/H2O or DMF/1,4-dioxane/H2O, 100 °C.
![Scheme 1. Synthesis of thieno[3,2-c]pyrazol-3-amine derivatives 16a–16e, 17a–17d and 18a–18n. Reagents and conditions: (a) various acyl chlorides or propane-1-sulphonyl chloride, pyridine, 110 °C; (b) substituted arylboronic acids or arylboronic acid esters, Pd(dppf)Cl2, CH3CO2K, DMF/EtOH/H2O or DMF/1,4-dioxane/H2O, 100 °C.](/cms/asset/127c3b76-dd81-4870-b2ed-ea7cb6fdbfb1/ienz_a_2086867_sch0001_b.jpg)
Table 1. Inhibitory effects of compounds against GSK-3β.
Figure 3. Effects of compound 16b on the activities of 21 protein kinases in vitro. Protein kinases were of human origin and assayed in the presence of 1.0 μM compound 16b or vehicle (DMSO). The enzymatic activity was measured in the presence of Km ATP. Kinase activities were given as the mean of twice determinations. AMPKα1, AMP-activated protein kinase 1; AMPKα2, AMP-activated protein kinase 2; CDK4/cyclinD3, cyclin-dependent protein kinase-4/cyclinD3; CDK5/p35, cyclin-dependent protein kinase-5/p35; CHK1, checkpoint kinase-1; CK2, casein kinase-2; Lck, lymphocyte kinase; MSK1, mitogen- and stress-activated protein kinase-1; p70S6K, p70 ribosomal protein S6 kinase; PDK1, 3-phosphoinositide-dependent protein kinase-1; PKA, cAMP-dependent protein kinase; PKBα, protein kinase Bα; PKCα, protein kinase Cα; PRAK, p38-regulated/activated kinase; SAPK2a, stress-activated protein kinase-2a; SAPK2b, stress-activated protein kinase-2b; SAPK3, stress-activated protein kinase-3; SAPK4, stress-activated protein kinase-4; SGK, serum- and glucocorticoid-induced protein kinase.
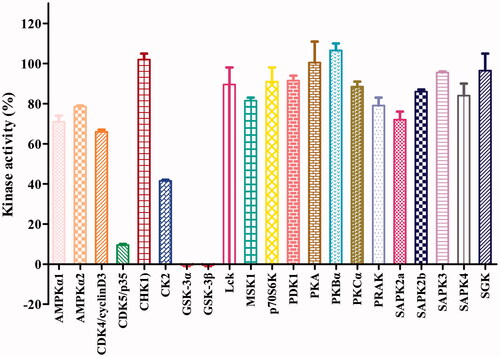
Figure 4. (A) Docking model of compound 16b in the ATP binding pocket of GSK-3β (PDB: 4ACG). Compound 16b was shown in green colour stick model, and hydrogen-bonding interactions were shown as purple dotted lines; (B) 2D interactions diagram of 16b. For clarity, only the polar hydrogen atoms were shown.
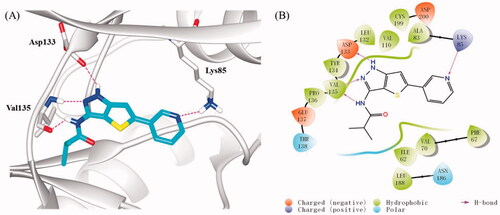
Figure 5. Cell viability of SH-SY5Y cells exposed to compound 16b at different concentrations (range from 3.125 − 50 μM) for 24 h. Vehicle treater cells were used as control. The results were expressed as the percentage of viable cells observed after treatment with compound 16b respect to vehicle-treated cells (100%) and shown as the mean ± SD from at least three separate experiments.
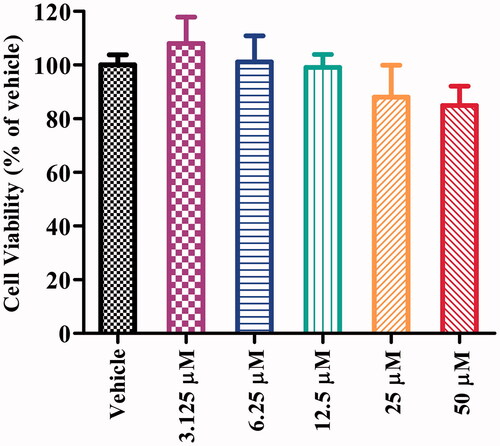
Figure 6. (A) The effect of 16b on phosphorylation of GSK-3β at Ser9; (B) the effect of 16b on β-catenin abundance. Protein expressions were detected by immunoblot analysis with a specific antibody. Values are reported as the mean ± SD of three independent experiments. *p < 0.05, **p < 0.01, ***p < 0.001 vs control.
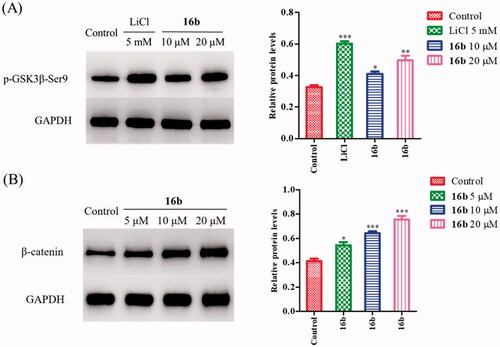
Figure 7. Inhibition of Aβ-induced tau phosphorylation by 16b in SH-SY5Y cells. Values are reported as the mean ± SD of three independent experiments. *p < 0.05, **p < 0.01, ***p < 0.001 vs control.
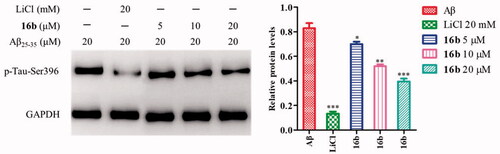
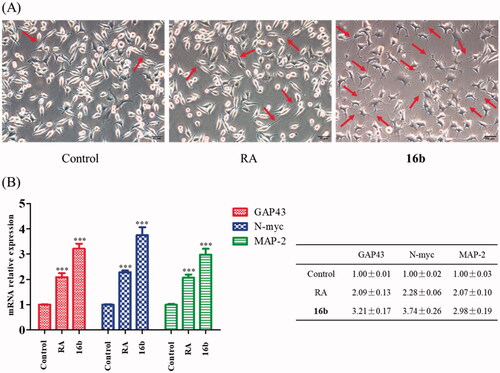
Figure 8. (A) Effect of 16b (10 μM) on neurite outgrowth (72 h). Red arrows indicated cells bearing neurites. Pictures were taken at 200 × magnification; (B) Effect of 16b (10 μM) on neurogenesis markers expressions (24 h). ***p < 0.001 vs control.