Figures & data
Figure 1. X-ray structure of bovine RPE65 (PDB code 3FSN). (A) The two monomers of the homodimer are shown in beige and cyan, with the corresponding dimer-mediating regions (DMS) coloured purple and orange, respectively. (B) A close up of a single monomer is shown, highlighting the distance of the catalytic site from the DMS, in which the two residues A393 and N302, associated with known missense mutations, are shown.
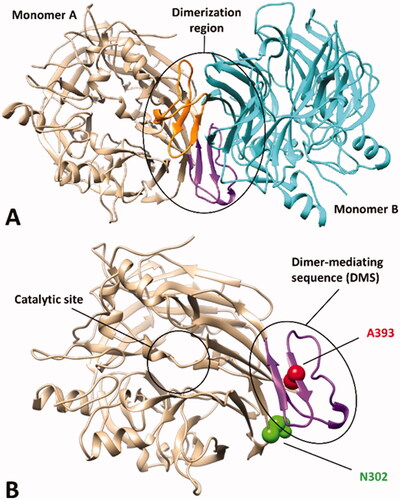
Figure 2. Results of the MD simulation studies performed on the wild-type hRPE65 system (A): (B) RMSD results obtained after 5 µs of MD simulation using the HMR scheme; (C) average structures of wild-type hRPE65 system obtained from the last 2 µs of MD simulation using classic (red) and HMR (green) approaches; (D) RMSF results obtained after 5 µs of MD using classic and HMR approaches.
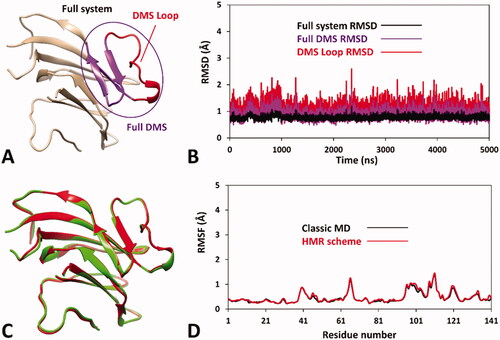
Figure 3. MD results obtained for A393E and N302I variants of hRPE65. (A) Average structures of A393E and WT systems obtained from the last 2 µs of MD simulation; the DMS of the two systems is respectively coloured red and purple. (B) RMSD of the DMS α carbons during 5 µs of MD simulation obtained for A393E system compared to WT. (C) RMSF of the whole A393E system α carbons compared to WT. (D) Average structures of N302I and WT systems obtained from the last 2 µs of MD simulation; the DMS of the two systems is respectively coloured green and purple. (E) RMSD of the DMS α carbons during 5 µs of MD simulation obtained for N302I system compared to WT. (F) RMSF of the whole N302I system α carbons compared to WT.
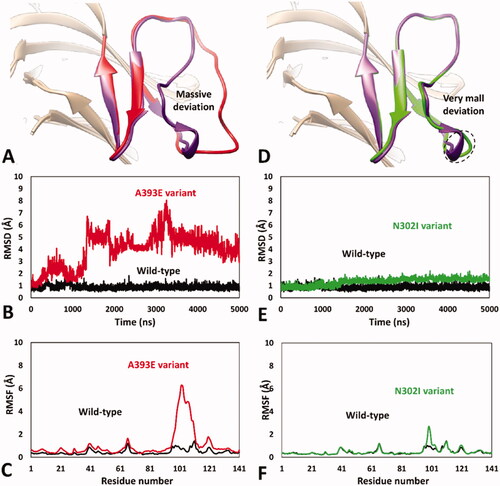
Figure 4. Structure of the DMS-focussed dimeric system compared to the full RPE65 dimer (PDB code 3FSN). The two monomers of both systems are shown in beige and cyan, with the corresponding DMS coloured purple and orange, respectively.
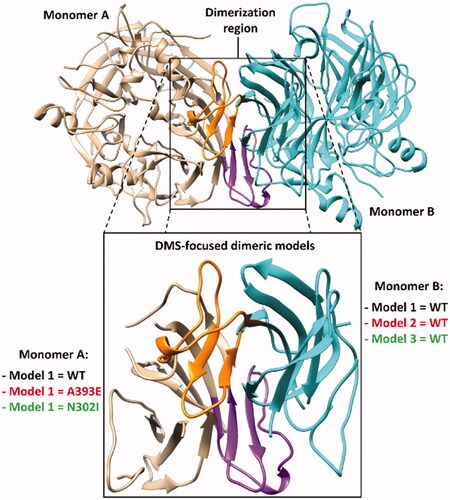
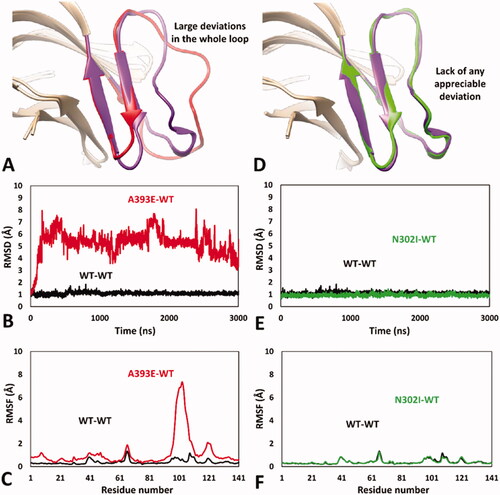
Figure 5. MD results obtained for the dimeric A393E-WT and N302I-WT models of hRPE65. (A) Average structures of A393E and WT monomers obtained from the last µs of MD simulation; the DMS of the two systems is respectively coloured red and purple. (B) RMSD of the DMS α carbons during 3 µs of MD simulation obtained for A393E monomer compared to WT. (C) RMSF of the whole A393E monomer α carbons compared to WT. (D) Average structures of N302I and WT monomers obtained from the last µs of MD simulation; the DMS of the two systems is respectively coloured green and purple. (E) RMSD of the DMS α carbons during 3 µs of MD simulation obtained for N302I monomer compared to WT. (F) RMSF of the whole N302I monomer α carbons compared to WT.