Figures & data
Figure 1. GC-MS analysis of volatile oils of (I) anise and (II) star anise extracted by different techniques, (a, d) solvent extraction, (b, e) microwave-assisted extraction, and (c, f): hydro-distillation, showing the predominance of trans-anethole in both oils.
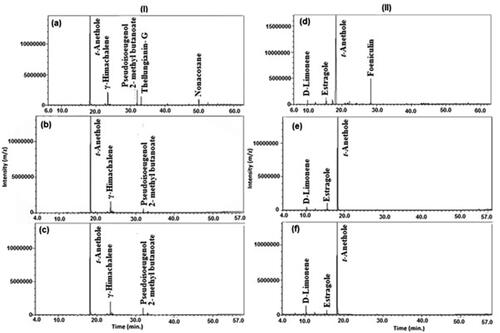
Figure 2. A schematic stacked bar charts showing relative percentages of total identified peak area (A) different classes of compounds except for phenyl propanoids and (B) phenyl propanoids class identified by GC-MS in anise and star anise using different extraction techniques.
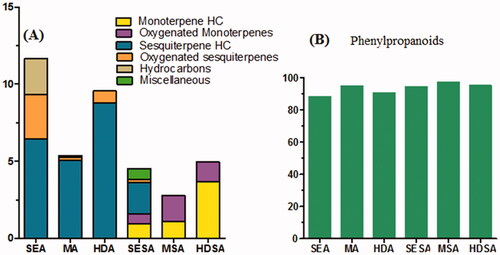
Table 1. GC-MS analyses of volatiles of anise and star anise oils prepared by different methods (solvent extraction, microwave and hydrodistillation), whereas n = 3.
Figure 3. The score plot of principal component analysis (PCA) (A) and hierarchical clustering analysis (HCA) dendrogram (B) originated from the GC data set of anise and star anise samples obtained by different extraction methods.
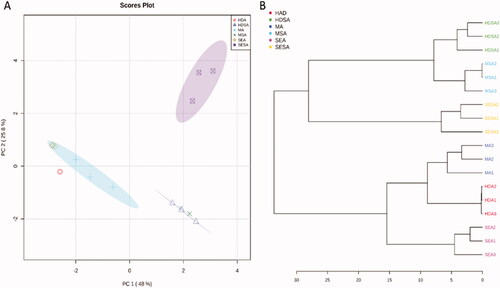
Figure 4. Heatmap represents the relative abundance of volatile metabolites extracted from anise and star anise fruits. Hierarchical clustering was done using Pearson’s correlation and average linkage. Heatmap colours represent log10 and Pareto-scaled values of relative metabolite abundance as indicated in the colour key. SEA: solvent extraction anise; MA: microwave extraction anise; HDA: hydro-distillation anise; SESA: solvent extraction star anise; MSA: microwave extraction star anise; HDSA: hydro-distillation star anise.
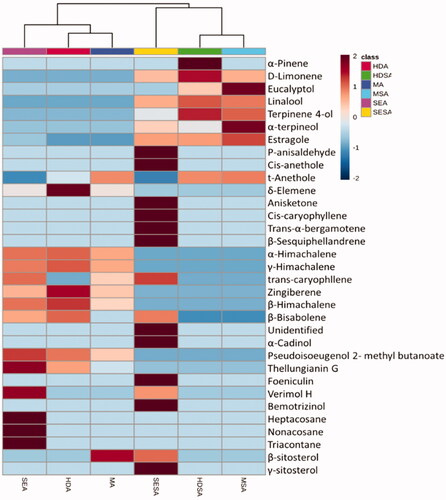
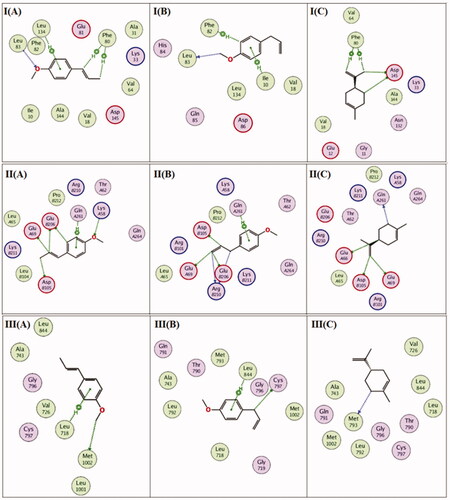
Figure 5. (I) 2 D-Binding diagram of trans-anethole (A), estragole (B) and D-limonene (C) with the active sites of tyrosinase enzyme. (II) 2 D-Binding diagram of trans-anethole (A), estragole (B) and D-limonene (C) with the active sites of NAD(P)H oxidase enzyme.
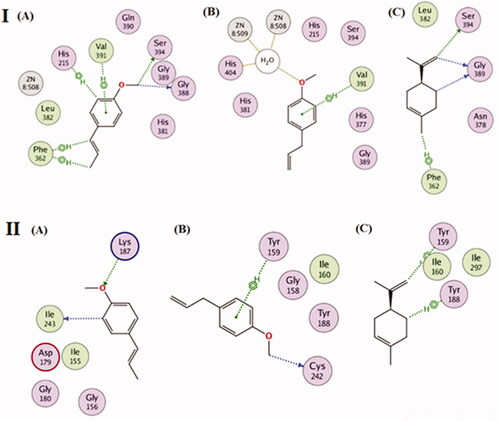
Figure 6. Correlation coefficients of different volatiles correlated to trans-anethole.
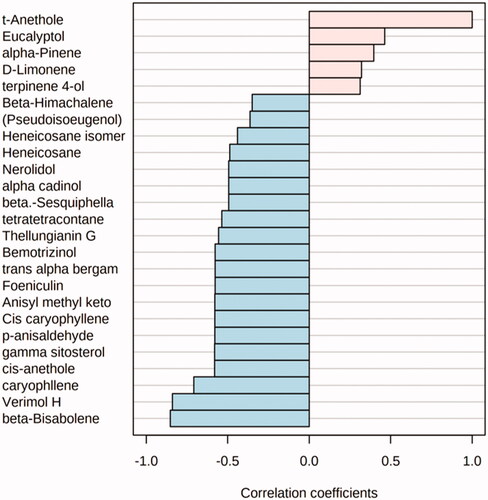
Figure 7. The effect of trans-anethole enriched Star anise oil on the phases of the cell cycle of HeLa cells.
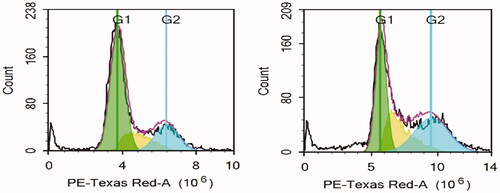
Table 2. The effect of trans-anethole enriched Star anise oil on the phases of the cell cycle of HeLa cells.
Figure 8. Triplicate Annexin V-FITC apoptosis assay for trans-anethole enriched Star anise oil (MSA) (B) using flow cytometry as compared to Doxorubicin control (A).
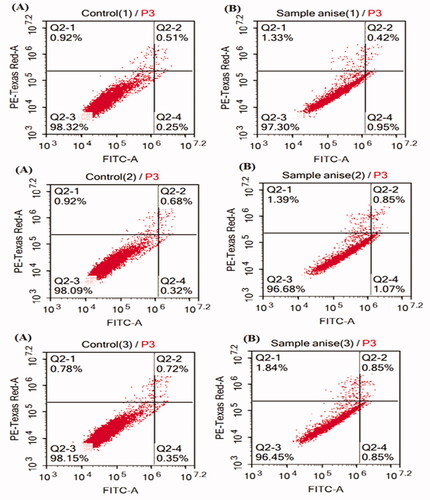
Table 3. The results of the Annexin V-FITC apoptosis assay for trans-anethole enriched Star anise oil (MSA).
Figure 9. 2 D-Binding diagram of trans-anethole (A), estragole (B) and D-limonene (C) with the active sites of CDK2 (I), CDK4 (II) or EGFR (III).