Figures & data
Scheme 1. Preparation of triazoles 3 and 4.
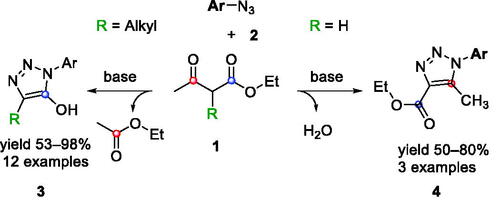
Figure 1. Few examples of approved drugs containing a pyridine unit.
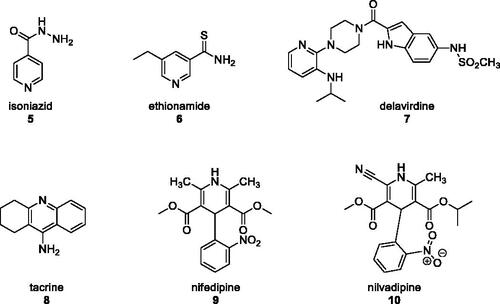
Figure 2. Pyridine-based triazoles tested through docking screening against the BioGPS cavity database.
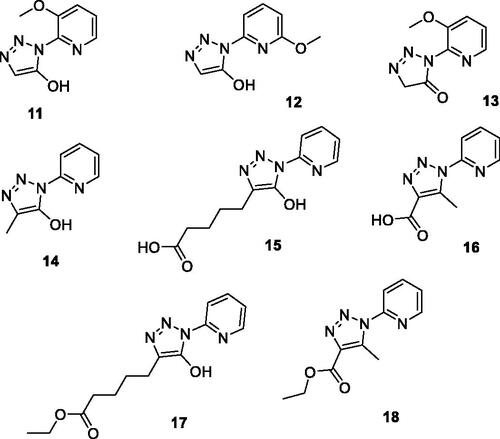
Figure 3. Natural and synthetic HATs inhibitors.
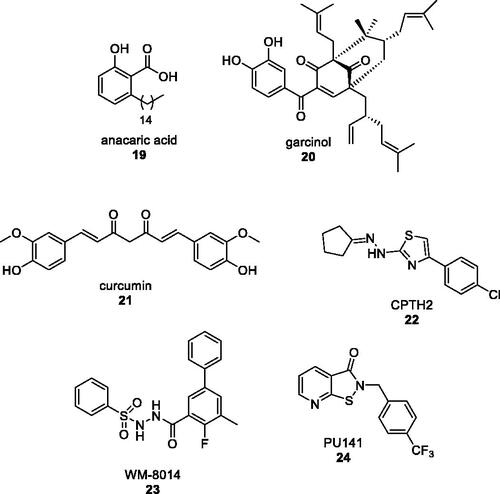
Table 1. Docking scores for triazoles 11–18 found for this dataset of twenty proteins.
Figure 4. PyMOL outlook of triazole 16 bound to KAT2A active site pocket. Triazole’s 16 nitrogens are coloured in blue, carbons in green and oxygens in red.
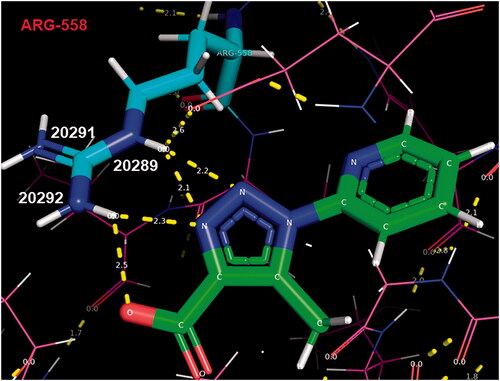
Table 2. Synthesis of pyridyl-based triazoles 26a-ea.
Table 3. Hydrolysis of triazoles 26a,b-d,e to reveal corresponding carboxylates 27a-dTable Footnotea.
Figure 5. KAT2A fluorescence tests performed on triazoles 16, 26c and 27a-d.
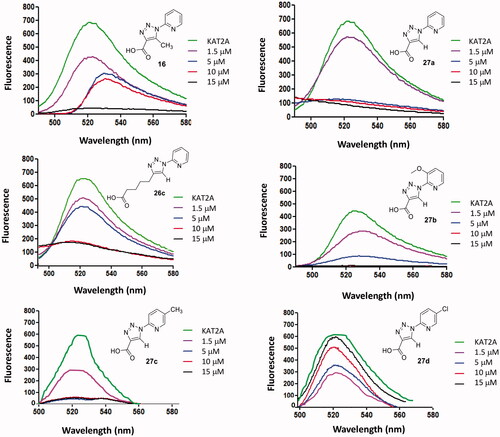
Figure 6. MTT assay performed on triazoles 16, 26c and 27a-d. NT = non treated.
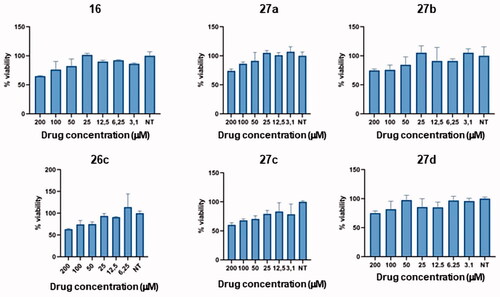
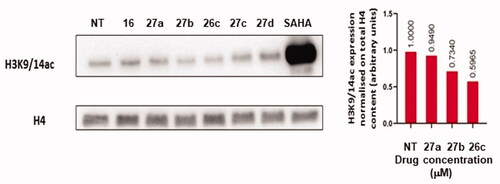
Figure 7. WB analysis (on the left) of 16, 26c and 27a-d showing H3K9/14Ac levels in U937 cells following 24 h treatment at the concentration of 200 µM; 5 µM SAHA treatment was used as a positive control of acetylation. Densitometric analysis of WB is shown on the right.