
Figures & data
Figure 1. Structures of representative FAK degraders.
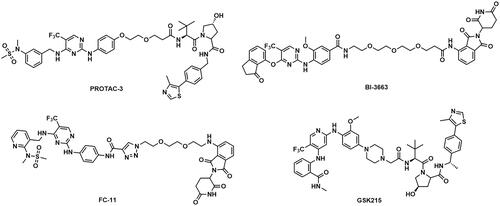
Figure 2. Three-dimensional space matching diagram and detailed interactions of PF-562271 in the ATP-binding site of FAK (PDB ID: 3BZ3). The interactions are illustrated with yellow dashed lines.
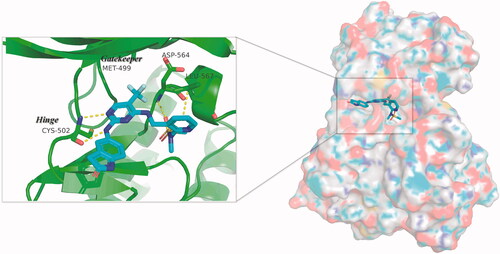
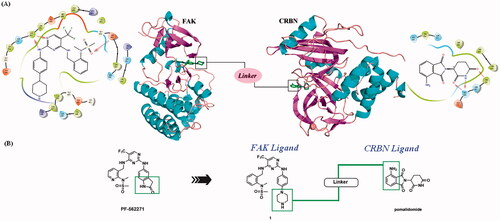
Figure 3. Design of FAK-targeting PROTACs. (A) Molecular docking model of compound 1 with FAK protein (PDB ID: 3BZ3) and the co-crystal binding modes of Pomalidomide (PDB ID: 4CI3). Piperazine fragment of 1 with CRBN E3 ligase ligand to develop FAK PROTACs by linkers. (B) FAK-targeting PROTACs including three parts: FAK Ligand, Linker, and CRBN Ligand.
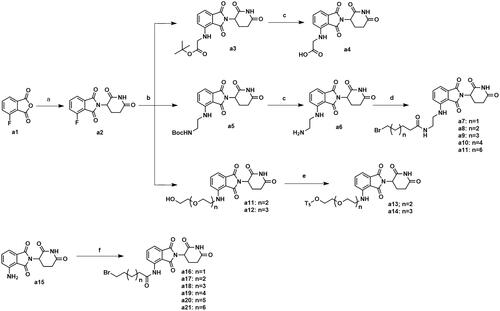
Scheme 1. Synthesis of intermediates a4, a7–a11, a13–a14 and a16–a21. Reagents and conditions: (a) 3-aminopiperidine-2,6-dione, NaOAc, AcOH, 140 °C, 58.3–68.7% yield; (b) DIPEA, DMF, 90 °C,53.6–65.2% yield; (c) CF3COOH, CH2Cl2, 25 °C, 86.3–90.2% yield; (d) HATU, DIPEA, 25 °C, 67.4–75.3% yield; (e) TsCl, Et3N, CH2Cl2, 30 °C, 72.6–79.3% yield; (f) corresponding bromocarboxylic acid, SOCl2, CH2Cl2, 40 °C, 61.5–85.8% yield.
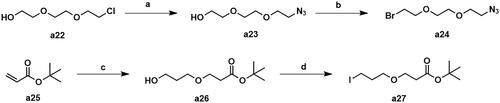
Scheme 2. Synthesis of intermediates a24 and a27. Reagents and conditions: (a) NaN3, DMF, 100 °C, 47.5% yield; (b) CBr4, PPh3, CH2Cl2, 25 °C, 53.7% yield; (c) propane-1,3-diol, tritionB, CH3CN, 25 °C, 36.2% yield; (d) I2, PPh3, imidazole, THF, 25 °C, 31.8% yield.
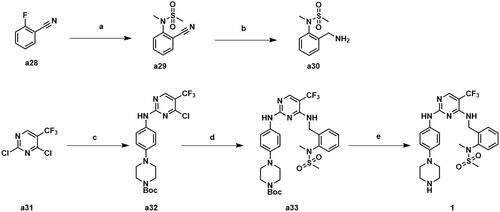
Scheme 3. Synthesis of compound 1. Reagents and conditions: (a) N-methylmethanesulfonamide, Cs2CO3, CH3CN, 80 °C, 82.6% yield; (b) BH3 (2 M in THF), anhydrous THF, 60 °C, 47.9% yield; (c) tert-butyl 4–(4-aminophenyl)piperazine-1-carboxylate, ZnBr2, TEA, t-BuOH/DCE, 0 °C, 72.3% yield; (d) a30, DIPEA, 1,4-dioxane, 100 °C, 81.3%; e) CF3COOH, CH2Cl2, 25 °C, 93.6% yield.
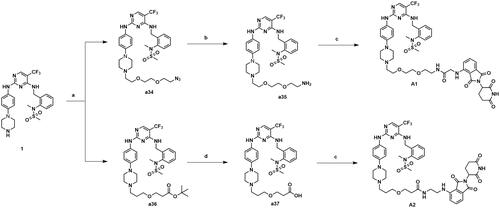
Scheme 4. Synthesis of compounds A1-A2. Reagents and conditions: (a) 81 or 84, K2CO3, CH3CN, 80 °C, 58.6–63.3% yield; (b) PPh3, THF/H20, 70 °C, 76.3–81.2% yield; (c) 65 or 67, HATU, DIPEA, CH2Cl2, 25 °C, 31.7–36.8% yield; (d) TFA, DCM, 30 °C, 95% yield.
Scheme 5. Synthesis of compounds A3–A15. Reagents and conditions: (a) a13–a14, DIPEA, DMF, 90 °C, 29.6–37.7%; (b) a16–a21 or a7–a11, KI, K2CO3, CH3CN, 80 °C, 29.4–41.9%.
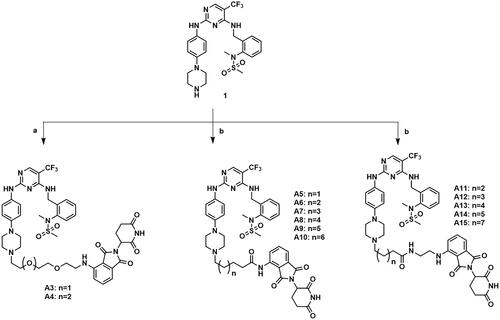
Figure 4. The enzyme inhibition activity curve of compound A1, A6, A13 and PF-562271.
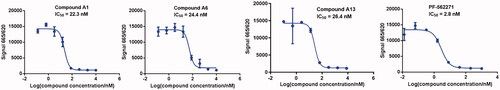
Table 1. FAK inhibition of compound 1 based PROTACs A1–A15 with different linkers.
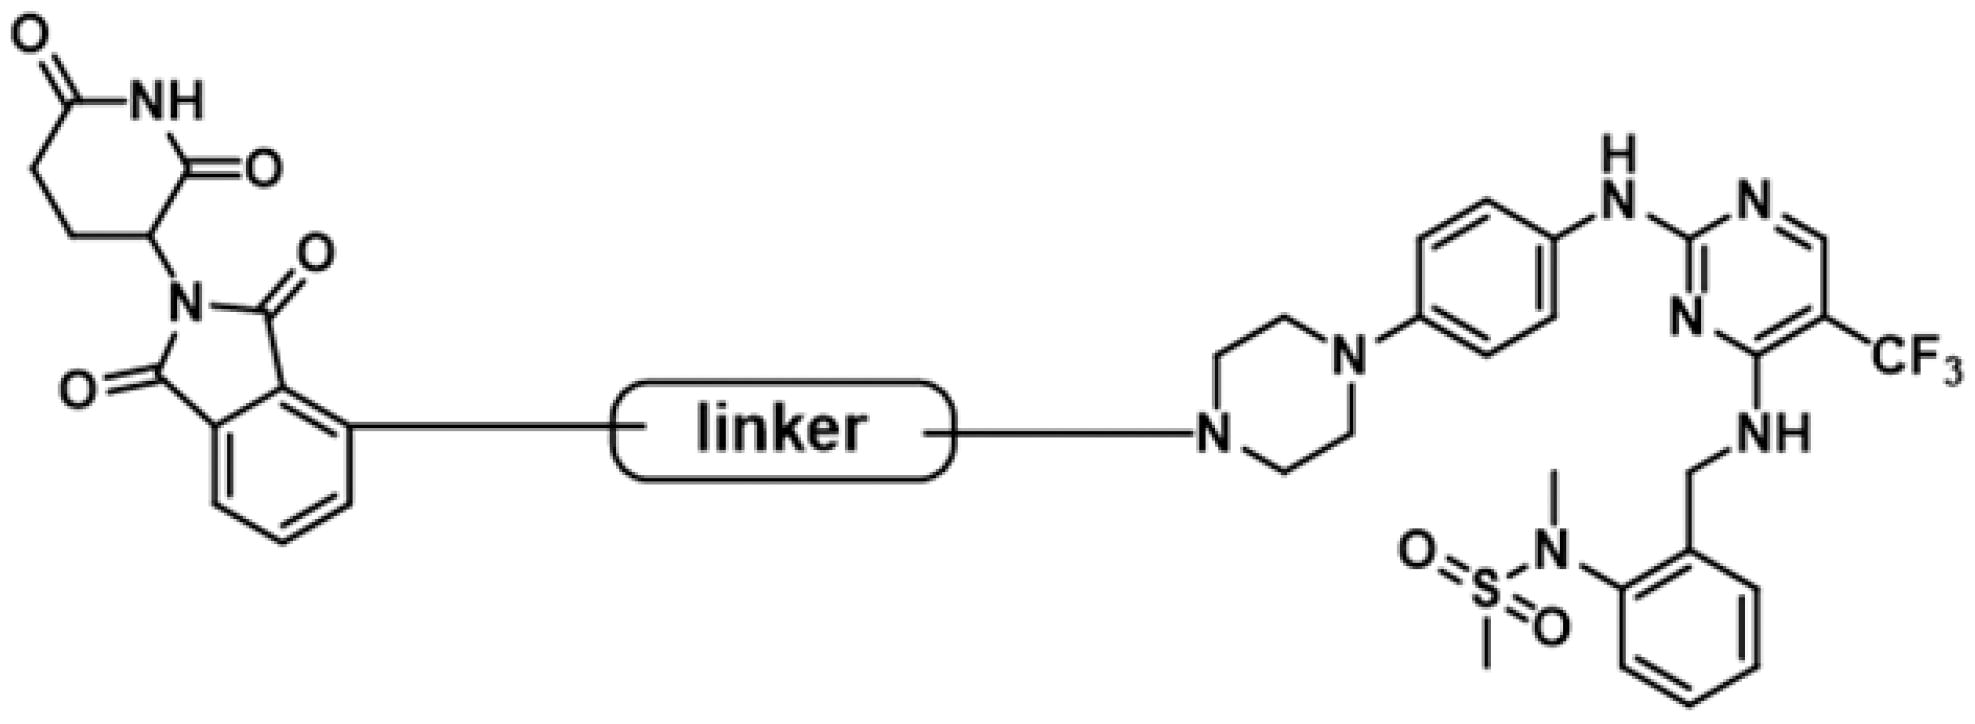
Figure 5. FAK-degrading efficiency of PROTACs A1–A15 in A549 cells (A) FAK levels in response to dose escalations of A1–A15 in the A549 cell line after treatment for 12 h, with glyceraldehyde-3-phosphate dehydrogenase (GAPDH) used as the loading control. The experiments were repeated three times, and representative images were selected. (B) FAK protein expression ratio vs control.
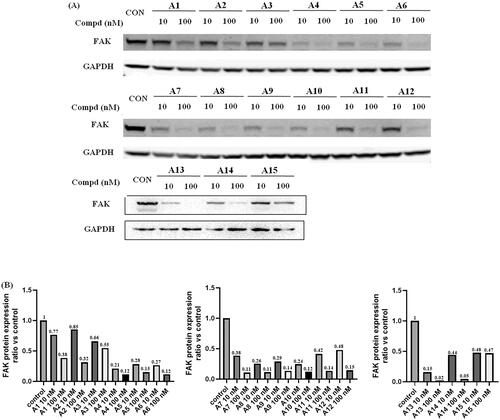
Figure 6. Antiproliferative activities of compound A13 and PF-562271 against A549 cells. Cell growth inhibition rate was measured by MTT assay. (mean ± SD, n = 3).
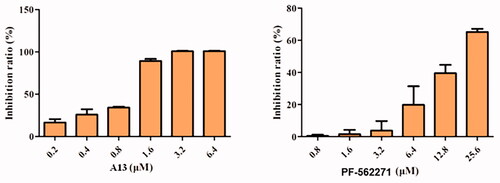
Figure 7. (A) The wound healing assay was performed to show the effect of indicated concentrations of PROTAC A13 on A549 lung cancer cell migration. (B) Quantitative analysis of the wound healing assay by PROTAC A13. The migration ratio of A549 cells treated with A13 was measured by wounding healing assay. (mean ± SD, n = 3). *p < 0.05, **p < 0.01 vs CON, #p < 0.05.
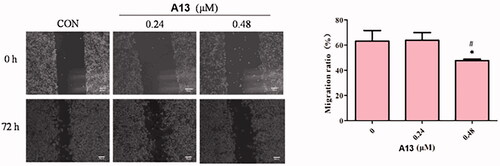
Figure 8. (A) Transwell assay was performed to show the effect of indicated concentrations of PROTAC A13 and PF-562271 on A549 lung cancer cell invasion. (B) Quantitative analysis of transwell assay by PROTAC A13 and PF-562271. The Invasion ratio of A549 cells treated with A13 or PF-562271 was measured by transwell assay. (mean ± SD, n = 3). *p < 0.05, **p < 0.01 vs CON; #p < 0.05, ##p < 0.01 vs 1/8 IC50; &p < 0.05, &&p < 0.01 vs 1/4 IC50.
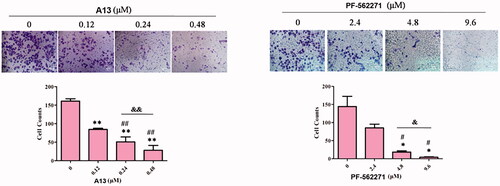
Table 2. Plasma stability of PROTAC A13.
Table 3. The membrane permeability of PROTAC A13 in Caco-2 cell lines.