Figures & data
Figure 1. Schematic representation of a gram-negative bacterium with the inner and outer membranes delimiting the periplasmic (in white) and cellular cytoplasm (in light blue). The passive CO2 diffusion through the bacterial cell and the bicarbonate transporter (orange colour), which actively vehicles bicarbonate from the periplasmic space to the cytoplasm are shown together with various CAs and their putative role(s).
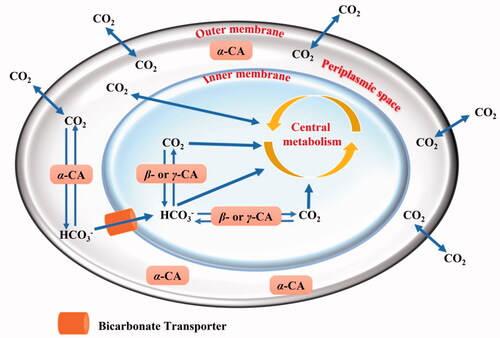
Figure 2. Protonogram of the two heterologously expressed E. coli CAs. The yellow band on the protonogram corresponds to the enzyme activity, which is responsible for the pH decrease from 8.2 to 6.8 due the dye transition point at acidic pH values. Legend: Lane STD, molecular markers; Lane 1, purified CynT2; Lane 2, purified EcoCAγ.
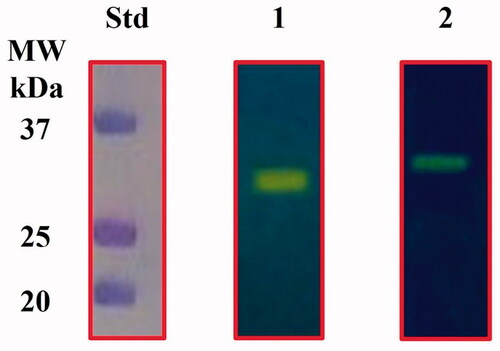
Table 1. Kinetic characteristics of the CO2 hydration reaction catalysed by α-, β-, and γ-CA enzymes. Human (h) hCA I and II (α-CAs), at 20° C and pH 7.5 in 10 mM HEPES buffer; CynT2 and EcoCAγ determined at 20° C, pH 8.3 in 20 mM TRIS buffer and 20 mM NaClO4. We also present inhibition data using the clinically relevant sulphonamide AZA (5-acetamido-1,3,4-thiadiazole-2-sulphonamide).
Figure 3. Effect of AZA on E. coli cells grown in MH for 6 h in presence of the eight different concentrations of AZA reported on the x-axis. (A) Bacterial growth has been monitored by measuring the optical density at 600 nm. (B) reports the wells showing the E. coli growth and the control represented by the bacterial cells with no AZA. Each data point is the mean value of at least three independent experiments.
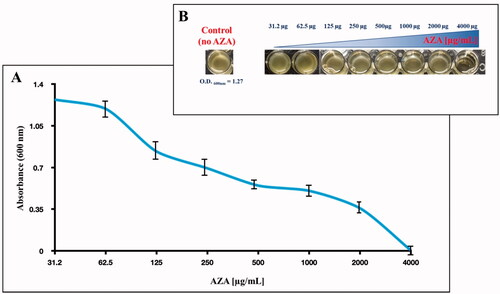
Figure 4. The reaction of phenol–sulphuric acid assay with glucose. Phenol in the presence of sulphuric acid is used for the quantitative colorimetric determination of glucose. Glucose by the action of concentrated sulphuric acid is dehydrated to hydroxymethylfurfural. These compounds then react with phenol to produce the reaction product (phenol- hydroxymethylfurfural), having a yellow-gold colour. The phenol-hydroxymethylfurfural is directly proportional to the amount of glucose present in the medium.
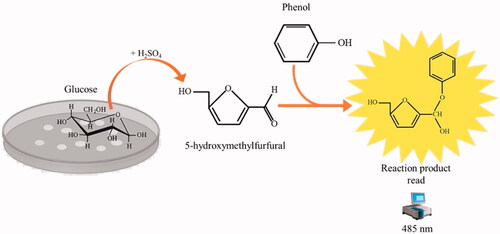
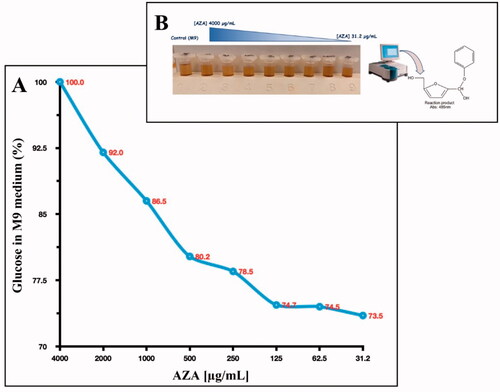
Figure 5. Glucose consumption by E. coli cells. Panel A shows the glucose consumption curve at different AZA concentrations (from 4000 to 31.2 g/mL) and using 1.0 × 10⁵ E. coli cells. The phenol–sulphuric acid assay was performed after the E. coli cells were incubated for 6 h in the M9 medium supplemented with a final concentration of 0.4% glucose. Panel B shows the tubes containing the different concentrations of AZA and the glucose at 04%. The yellow-gold colour was developed by the reaction of the phenol with the 5- hydroxymethylfurfural, which was produced by the interaction of sulphuric acid with glucose. Each data point is the mean value of at least three independent experiments.