Figures & data
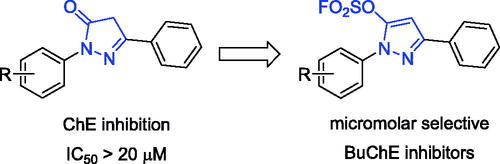
Figure 1. The general design strategy in this study.
Scheme 1. Chemical structures of compounds M1–M4 and K1–K26.
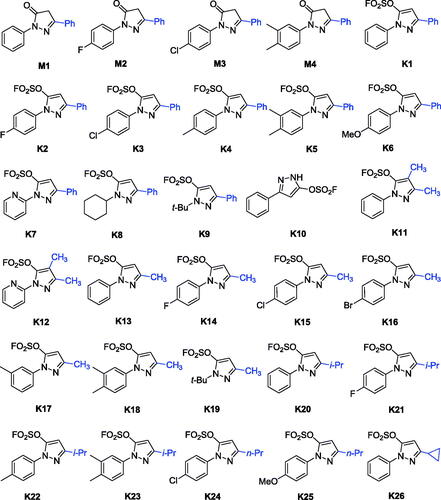
Table 1. Inhibitory activities against eeAChE and eqBuChE of compounds M1–M4 and K1–K25 (IC50, µM or % inhibition at 20 µM).a
Figure 2. SARs of the pyrazole-5-sulfofluoridate on BuChE inhibitory activity.
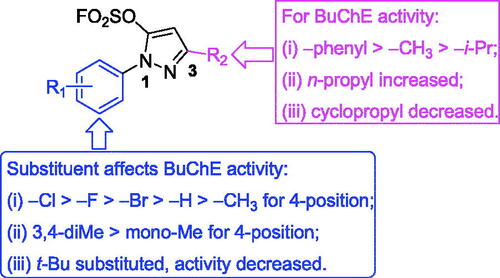
Table 2. Inhibitory activity on hAChE and hBuChE.a
Figure 3. Relationship between eqBuChE inhibition and various concentrations of K3 (A). Lineweaver‒Burk plots of eqBuChE inhibition kinetics of K3 (B).
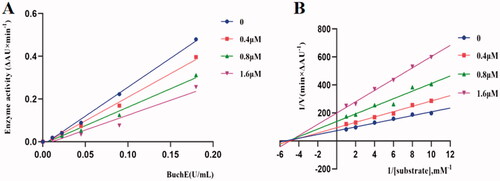
Figure 4. 3 D diagram (A) and 2 D diagram (B) of compounds K3 into hBuChE (PDB: 6QAA) performed respectively. Active site residues of hBuChE are presented as sticks with carbon atoms represented in light green. The green dashed lines represent hydrogen bonds, the light blue dashed lines represent halogen interaction bonds and the light pink dashed line represents π-alkyl interaction.
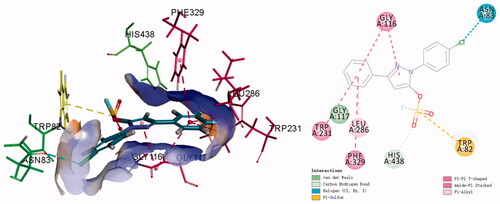
Figure 5. The cytotoxic effect of active compounds on L02 (A) cells and HepG2 (C) cells for 24 h was determined at a concentration of 25 µM, and untreated cells were used as controls. L02 (B) cells and HepG2 (D) cells were treated with donepezil and K3 at concentrations ranging from 1 to 50 µM for 24 h. Untreated cells were used as controls. Results were expressed as a percentage of cell survival versus untreated cells (control) and as mean ± SEM (n = 3, *p < 0.05, **p < 0.01, ***p < 0.001 vs control group).
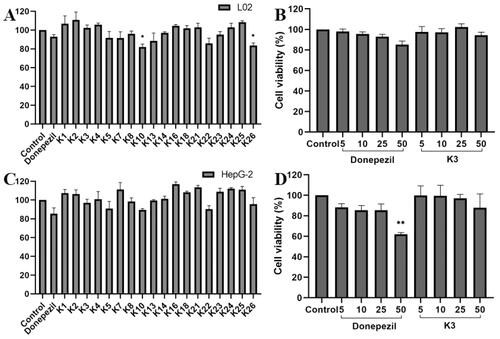
Figure 6. Neuroprotective effect of K3 (0–25 µM) against H2O2-induced (100 µM) PC12 neurons injury for 24 h (cells are given K3 and incubated for 3 h and then given H2O2 peroxide to model). Results represent mean ± SEM (n = 3, ###p < 0.001 vs control group; **p < 0.01, ***p < 0.001 vs model group).
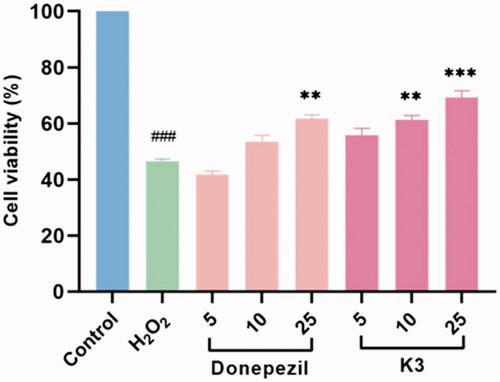
Figure 7. PAMPA-BBB penetration study of K3. (A) Results of the PAMPA-BBB assay for six commercial drugs used in the experimental procedure validation and K3. (B) Linear correlation presenting experimental versus bibliographic data of commercial drugs. aBibl. values are reported data from the reference; bAll tests were obtained from three independent experiments; c“CNS +” (high BBB permeation): Pe (× 10‒6 cm/s) > 4.0; “CNS +/‒” (uncertain BBB permeation): Pe (× 10‒6 cm/s) from 2.0 to 4.0; “CNS ‒” (low BBB permeation): Pe (× 10‒6 cm/s) < 2.0.
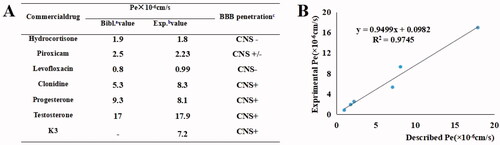
Figure 8. Results of in vivo acute toxicity evaluation. (A) Body weight of ICR mice (g) ‒ measurement time point (day); (B) ALT activity at 8, 22 and 36 h after single dosing (control) or K3; (C) AST activity at 8, 22 and 36 h after single dosing (control) or K3; (D) Histomorphological observation of mouse liver treated with K3 vector (control); The HE-stained field was 100 µM.
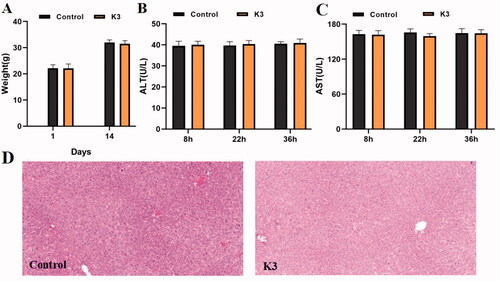
Figure 9. Effects of K3 and donepezil on oligomeric Aβ1–42-induced damage experiments in the MWM task. (A) Protocol followed for in vivo experiments. (B) Daily body weight of mice in different groups during treatment. (C) Learning curves of the escape latencies during the acquisition phase of different groups. (D) Average footprints of mice in MWM on the last day of the study. (E) The time in the target quadrant during the acquisition phase of different groups. (F) The number of times the platform was crossed during the acquisition phase of different groups. icv: intraventricular injection; po: orally; MWM: Morris water maze. Data are presented as mean ± SEM (n = 8; ##p < 0.01, ####p < 0.0001 (vs control group), *p < 0.05, **p < 0.01 vs Aβ1–42 peptide model group).
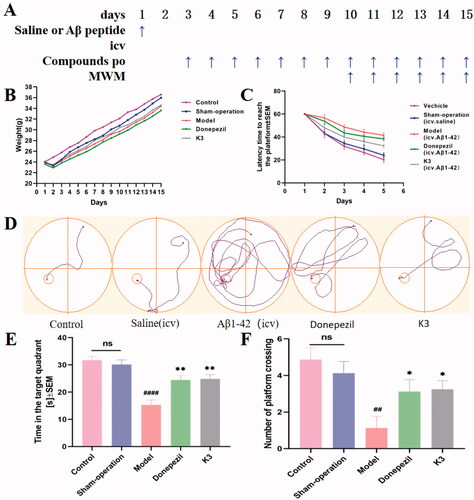
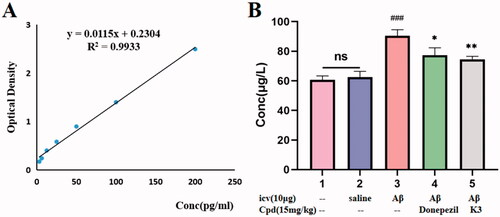
Figure 10. The Aβ1 − 42 total amount was quantifified by using a mouse Aβ1 − 42 ELISA kit. (A) Standard curve; (B) Aβ1 − 42 total amount in mice brains of different groups. Calculate brain tissue Aβ1–42 content according to linear regression equation, data are presented as mean ± SEM (n = 8; ###p < 0.001 (vs control group), *p < 0.05, **p < 0.01 vs Aβ1-42 peptide model group).