Figures & data
Table 1. Sequences and accession numbers for primers (forward, FOR; reverse, REV) used in qPCR
Figure 1. Drug design and identification of SPA7012 as PAK4 inhibitor. (A) Design strategy for novel PAK4 selective inhibitors. (B) Enzymatic IC50 curves for SPA7012, SPA7016 and SPA7017. (C) Representative structure of pyrido[3,4-d]pyrimidine derivatives. (D) Predicted binding mode of SPA7012 (PDB code: 4O0V). Original ligand GNE-2861 (green) and SPA7012 (brown) are presented in the stick model. The hydrogen bonds are indicated as a green dashed line.
![Figure 1. Drug design and identification of SPA7012 as PAK4 inhibitor. (A) Design strategy for novel PAK4 selective inhibitors. (B) Enzymatic IC50 curves for SPA7012, SPA7016 and SPA7017. (C) Representative structure of pyrido[3,4-d]pyrimidine derivatives. (D) Predicted binding mode of SPA7012 (PDB code: 4O0V). Original ligand GNE-2861 (green) and SPA7012 (brown) are presented in the stick model. The hydrogen bonds are indicated as a green dashed line.](/cms/asset/cebe6e68-1be2-4630-b3b8-48f8c6176cf3/ienz_a_2106478_f0001_c.jpg)
Scheme 1. Synthesis of 1-aminopyrido[4,3-b]indole derivatives. Reagents and conditions: (a) trimethyl orthoacetate, 100 °C; (b) DMF-DMA, MeOH, reflux; (c) 48% HBr, AcOH, room temperature; (d) conc. HCl, 160 °C; (e) phenylhydrazine, Ph2O, 240 °C; (f) POCl3, reflux; (g) p-methoxybenzylamine, 200 °C; (h) 1-bromo-3-iodobenzene, Cu, K2CO3, 18-crown-6, 1,2-dichlorobenzene, 180 °C; (i) TFA, 60 °C; and (j) R-prop-2-yn-1-ol, Pd(PPh3)2Cl2, TEA/DMSO (2:1), 70 °C.
![Scheme 1. Synthesis of 1-aminopyrido[4,3-b]indole derivatives. Reagents and conditions: (a) trimethyl orthoacetate, 100 °C; (b) DMF-DMA, MeOH, reflux; (c) 48% HBr, AcOH, room temperature; (d) conc. HCl, 160 °C; (e) phenylhydrazine, Ph2O, 240 °C; (f) POCl3, reflux; (g) p-methoxybenzylamine, 200 °C; (h) 1-bromo-3-iodobenzene, Cu, K2CO3, 18-crown-6, 1,2-dichlorobenzene, 180 °C; (i) TFA, 60 °C; and (j) R-prop-2-yn-1-ol, Pd(PPh3)2Cl2, TEA/DMSO (2:1), 70 °C.](/cms/asset/27bd69f3-ee05-4a12-93f2-75b7293d661a/ienz_a_2106478_sch0001_b.jpg)
Scheme 2. Synthesis of the 4-aminopyrazolo[3,4-d]pyrimidine derivatives. Reagents and conditions: (a) trimethyl orthoacetate, 100 °C; (b) hydrazine monohydrate, EtOH, 80 °C; (c) formamide, 180 °C; (d) 1-bromo-3-iodobenzene, CuI, K2CO3, DMEDA, DMF, 110 °C; and (e) R-prop-2-yn-1-ol, Pd(PPh3)2Cl2, TEA/DMSO (2:1), 70 °C.
![Scheme 2. Synthesis of the 4-aminopyrazolo[3,4-d]pyrimidine derivatives. Reagents and conditions: (a) trimethyl orthoacetate, 100 °C; (b) hydrazine monohydrate, EtOH, 80 °C; (c) formamide, 180 °C; (d) 1-bromo-3-iodobenzene, CuI, K2CO3, DMEDA, DMF, 110 °C; and (e) R-prop-2-yn-1-ol, Pd(PPh3)2Cl2, TEA/DMSO (2:1), 70 °C.](/cms/asset/c6009c0b-d9d1-41ac-8050-cd074315e755/ienz_a_2106478_sch0002_b.jpg)
Scheme 3. Synthesis of the 4-aminopyrazolo[3,4-d]pyrimidine derivatives with a solvent-accessible moiety. Reagents and conditions: (a) CuI, Pd(PPh3)4, TEA, DMF, 70 °C; (b) Pd/C, H2, MeOH, room temperature; (c) 1-bromo-3-iodobenzene, CuI, K2CO3, DMEDA, DMF, 110 °C; and (d) 1-Ethynylcyclohexanol, Pd(PPh3)2Cl2, TEA/DMSO (2:1), 70 °C.
![Scheme 3. Synthesis of the 4-aminopyrazolo[3,4-d]pyrimidine derivatives with a solvent-accessible moiety. Reagents and conditions: (a) CuI, Pd(PPh3)4, TEA, DMF, 70 °C; (b) Pd/C, H2, MeOH, room temperature; (c) 1-bromo-3-iodobenzene, CuI, K2CO3, DMEDA, DMF, 110 °C; and (d) 1-Ethynylcyclohexanol, Pd(PPh3)2Cl2, TEA/DMSO (2:1), 70 °C.](/cms/asset/f0126093-141f-4a5f-9625-ce755a0a9930/ienz_a_2106478_sch0003_b.jpg)
Table 2. PAK4 enzyme inhibitory activity and calculated properties of synthesised compounds
Table 3. PAK subtype selectivity of SPA7012
Figure 2. Attenuation of hepatic I/R injury by SPA7012. (A) Schematic diagram of treatment of SPA7012 in C57BL/6 mice. (B) Serum levels of AST and ALT (n = 5). (C, D) Gross morphology of livers, microscopic pictures of liver sections and measurement of necrotic area (n = 5). (E) Immunofluorescence staining and quantification of TUNEL-positive apoptotic cells in liver tissues (n = 5). (F) Western blotting analysis of apoptosis-related proteins in liver tissues (n = 5). Values are the mean ± SD.** p < 0.01. I/R, ischaemia-reperfusion; HPF, high power field.
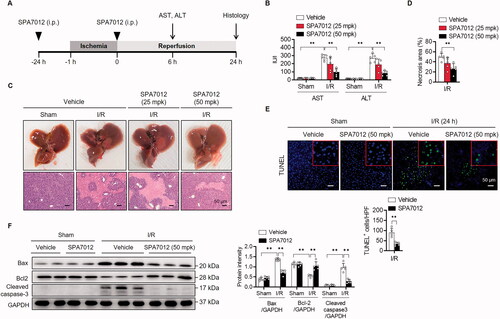
Figure 3. Attenuation of I/R-induced oxidative stress by SPA7012. (A and B) Hepatic levels of malondialdehyde (MDA) and glutathione (GSH) (n = 5). (C) Immunohistochemical staining for 4-hydroxynonenal (4-HNE) of liver tissues (n = 5). (D) A co-IP analysis in HEK293T cells after 24 h transfection. (E) Nrf2 protein levels in nuclear-(NE) and cytosolic extracts (CE) of I/R injured liver tissues. (F) ARE luciferase activity in HEK293T cells after 24 h transfection (n = 5). (G and H) Nrf2 and its target gene levels in liver tissues (n = 5). Values are the mean ± SD. **p < 0.01. I/R: ischaemia–reperfusion; HPF: high-power field; V: vehicle; S: SPA7012 50 mg/kg.
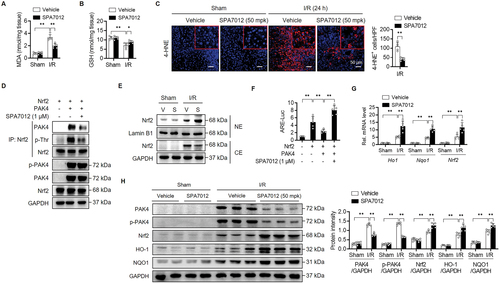
Figure 4. Attenuation of I/R-induced inflammation by SPA7012. (A) Immunofluorescence staining and quantification of F4/80-positive macrophages and Ly6G-positive neutrophils in liver tissues (n = 5). (B and C) The protein and mRNA levels of pro-inflammatory cytokines/chemokine in serum and liver tissues (n = 5). (D) Protein levels of NF-κB signalling pathway (n = 5). Values are the mean ± SD. **p < 0.01. HPF: high-power field.
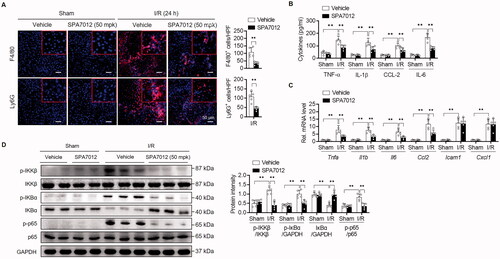
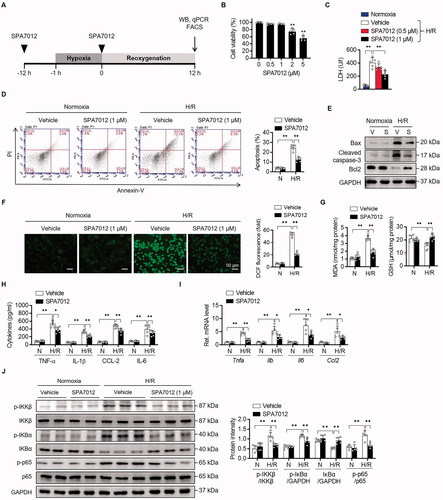
Figure 5. Attenuation of H/R-induced apoptotic cell death and cytokine production by SPA7012. (A) Schematic diagram of treatment of SPA7012 to primary hepatocytes. (B) MTT assay for cell viability (n = 5). (C) Lactate dehydrogenase (LDH) release from primary hepatocytes after 12 h reoxygenation (n = 5). (D and E) Analysis of apoptotic cell death by Annexin-V staining and Western blotting (n = 5). (F and G) Reactive oxygen species levels assessed using fluorescence microscopy following the changes in DCF fluorescence and colorimetric analysis of MDA and GSH (n = 5). (H and I) The protein and mRNA levels of pro-inflammatory cytokines/chemokine in culture media and hepatocytes (n = 5). (J) Protein levels of NF-κB signalling pathway (n = 5). Values are the mean ± SD. *p < 0.05 and **p < 0.01. H/R: hypoxia-reoxygenation.