Figures & data

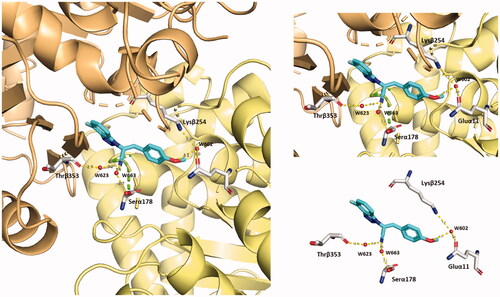
Figure 1. Schematic representation of the mitotic cycle. On the right, a picture of an MT growth cone, made of α,β-tubulin heterodimers. Created (and partly adapted from a template) with BioRender.com.
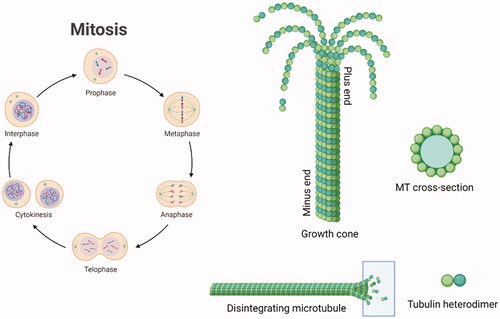
Figure 2. Chemical structures of colchicine and its derivative ZD6126, combretastatin A-4, our previous lead compounds 34 and 9a, and target compound 5 of the present work.
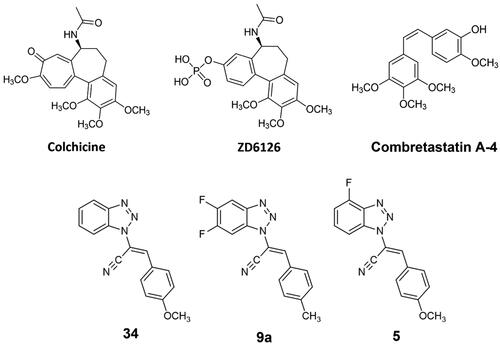
Figure 3. 2D-representation of the best-docked pose of compound 5 and its nonpolar interactions with the amino acids (here labelled with the three-letters denomination, the belonging chain and the number of the protein secondary structure) of the binding pocket at the interface of α,β-tubulin. Picture made with LigPlot+.Citation35 Hydrophobic interactions are depicted as hashes, for both protein and ligand atoms. Atoms are differently coloured: black (C), blue (N), green (F), and red (O).
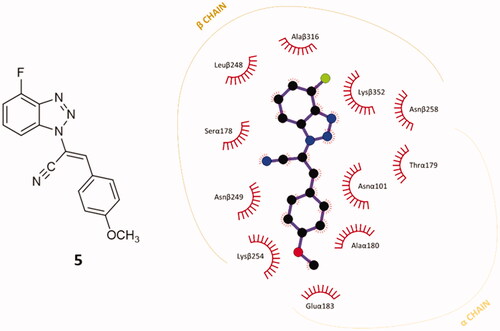
Figure 4. Three-dimensional representation of the binding conformation of compound 5 in CBS at the interface between α- and β-tubulin. Α-subunit is coloured in pale-yellow tint, β-one in light-orange tint. The ligand is in blue marine, interacting amino acids in blue. Yellow dashed lines consider the polar interactions, with a distance value in Å. Native 3D figures were produced via PyMOL.Citation33
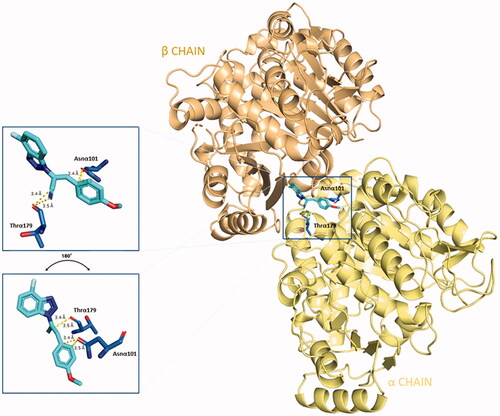
Table 1. Chemical structure of the final compounds (5–13) and pharmacokinetic and drug-likeness properties obtained by SwissADME prediction. 
Scheme 1. General procedure for final compounds (5–13). aReaction conditions: chloroacetonitrile/KOH (1:1.1), CH3CN, reflux, o/n. bReaction conditions: (A) DMA (ratio 1:1.2), CH3CN; (B) DIMCARB (ratio 1:1.2), CH3CN; (C) Cs2CO3 (ratio 1:1.2), toluene; yields:31–60%.
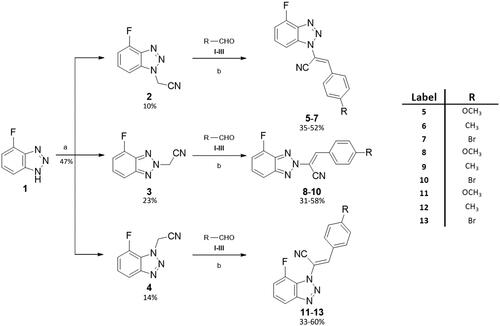
Figure 5. NCI60 cancer analysis on compounds 5 (a) and 12 (b). The histograms illustrate %GI of cancer cells elicited by 5 (green) and 12 (blue) at 100 nM.
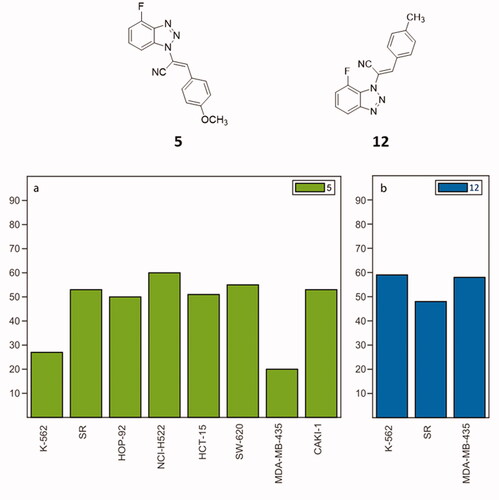
Figure 6. Inhibition of HeLa cell proliferation in vitro, as determined by the XTT assay. (A) HeLa cells were incubated with DMSO (vehicle control) and with compounds 34 (positive control) 5 and 12 at 2 and 5 μM concentrations. (B) HeLa cells were treated with compounds 34, 5 e 12 at different concentrations in a range between 0.125–2 μM. All experiments were performed in triplicate.
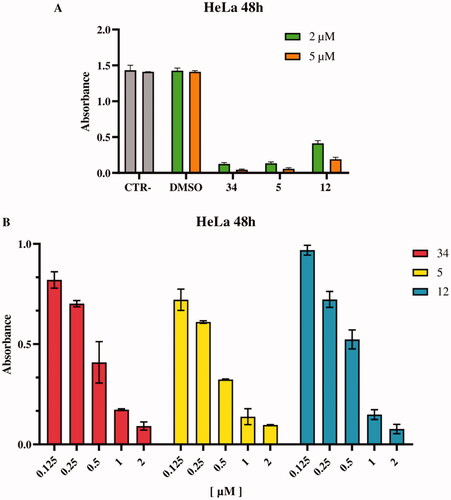
Table 2. Cytotoxic activities of the new compounds 5–13 as given by IC50 values in HeLa cells.
Figure 7. Distribution of HeLa cell in cell cycle assay. At 2 μM, both compounds 5 and 12 cause cell blockade in the G2/M phase compared to control and DMSO after 24 h. Compound 34 was used as a positive control.
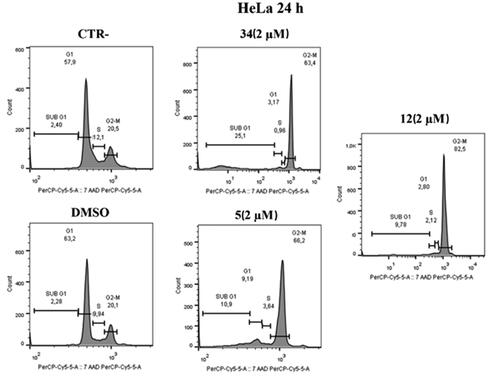
Figure 8. Cell cycle distribution after administration of compound 5 or 12, at 2 μM after 24 h. At a concentration of 2 μM, compounds 5 and 12 cause cell blockage in the G2/M phase compared to control and DMSO. Compound 34 was used as a positive control.
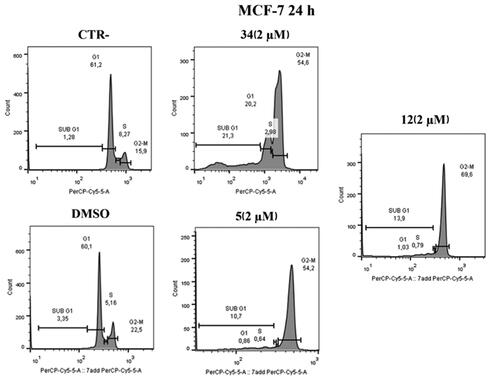
Figure 9. Annexin V analysis of HeLa cell lines after treatment with 2 µM of compounds 5 and 12 after 24 h. DMSO and compound 34 were used as controls. Apoptotic, necrotic, and live cells were stained with Annexin V FITC/7-AAD and then analysed by BD FACS DIVA software.
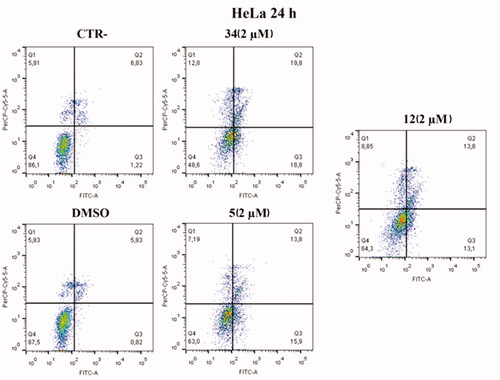
Figure 10. Annexin V analysis of MCF-7 cell line after administration of compounds 5 and 12 (2 µM) after 24 h. DMSO and compound 34 were used as controls. Apoptotic, necrotic, and live cells were stained with Annexin V FITC/7-AAD and then analysed by BD FACS DIVA software.
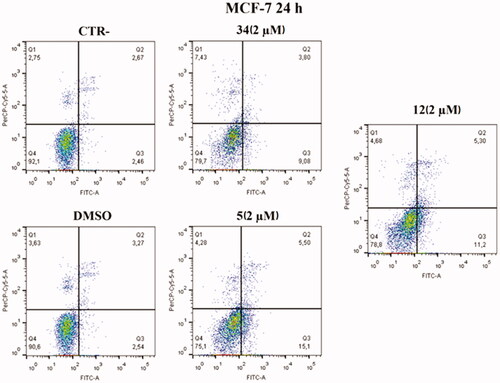
Figure 11. Protein levels of PARP-1 and cleavage of PARP-1 in HeLa and MCF-7 cell lines after treatment with compounds 5 and 12 at 1 µM. Caspase-mediated cleavage of PARP1indicated activation of cell death by apoptosis in both cell lines. DMSO and compound 34 were used as negative and positive controls, respectively. All results were normalised using GAPDH.
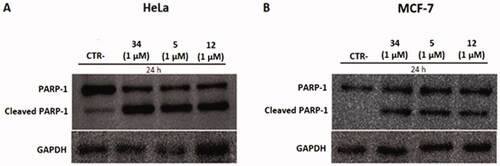
Figure 12. High-content confocal screening performed on HeLa cells. (A) Overview of an acquisition performed at 5×, nuclei are stained in blue (DAPI), scale bar 20 mm. (B) Exemplificative images of HeLa cells stained for β-tubulin (green) and nuclei (DAPI) treated or not with compound 5 at different concentrations. (C) Statistical analysis of nuclear/cytoplasm area of HeLa cells shown in B, performed using one-way ANOVA. Data are expressed as mean ± SD N = 3, α = 0.5 ***p < .0001.
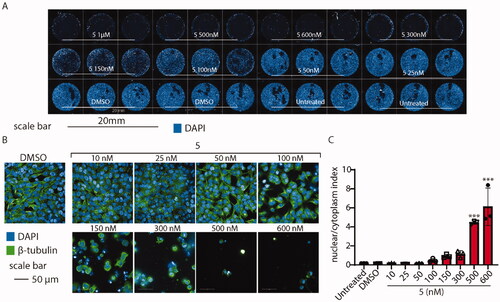
Figure 13. Administration of compound 5 decreases A375 melanoma cells viability. (A) Overview of high-content screening performed on A375 cells treated or not with compound 5 and doxorubicin. (B) IC50 of the sole compound 5 (black) or in association with doxorubicin (red). IC50 values were calculated by counting the number of nuclei in every experimental condition. Compound 5 IC50 when co-administered with doxorubicin is decreased from 103.4 to 85 nM.
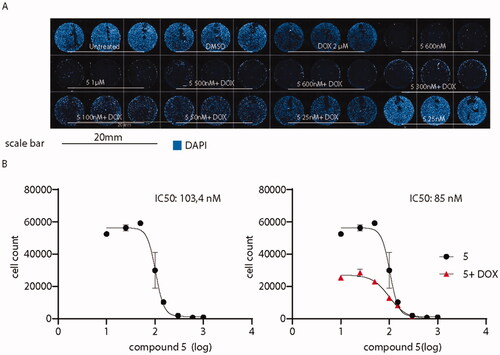
Figure 14. (A) Tubulin polymerisation assay. Tubulin was pre-incubated with compound 5 at different concentrations. Then, tubulin assembly was assessed by measuring absorbance every 2 s for 60 min at 340 nm. Compound 5 (red lines) decreases tubulin polymerisation at every concentration tested (1, 3 and 10 μM); (B) Colchicine-competition assay. Tubulin was pre-incubated with an equimolar concentration of colchicine with compound 5 at 1 μM. Then, tubulin polymerisation was assessed by measuring absorbance every 2 s for a total of 30 min. Statistical analyses were performed using a one-sample T test and expressed as mean ± SD, ***p ≤ .001.
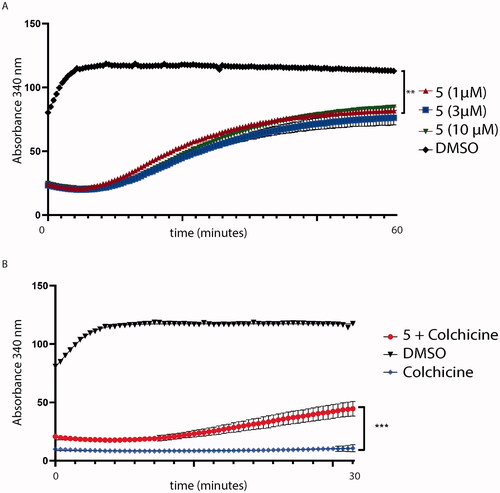
Figure 15. Superimposition of the predicted conformation of compound 5 (coloured in blue marine) and the crystal structure of colchicine (in violet-purple, PDB ID: 4O2B).
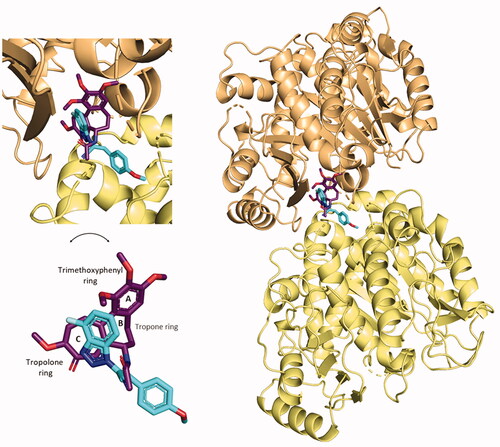
Figure 16. Representation of the solvent-mediated polar interactions established by compound 5 (blue marine). Water molecules (W623–W663–W602) are simplified by red spheres.