
Figures & data

Figure 1. EGFR inhibitors and their pharmacophoric features.
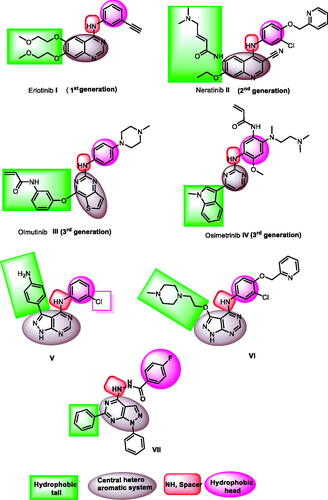
Figure 2. ATP binding site of EGFR-TK cavity composed of five main featuresCitation41 and summary of the possible modifications of EGFR-TK inhibitors.
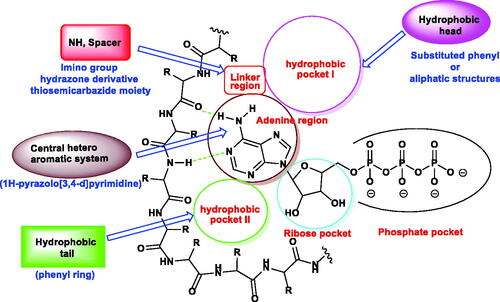
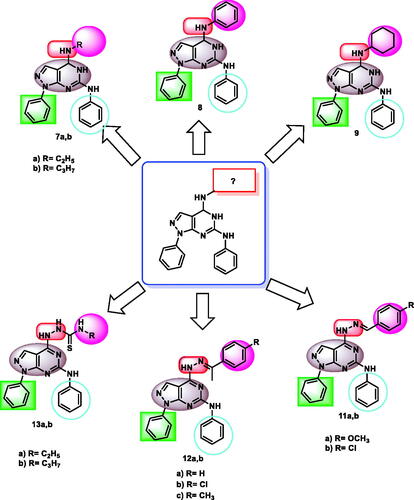
Figure 3. Rationale of molecular design of the new proposed EGFR-TK inhibitors.
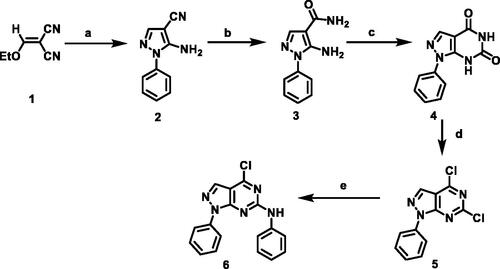
Scheme 1. Synthetic protocol of starting compounds. Reagents and conditions: (a) phenyl hydrazine, absolute ethanol, reflux, 2 h; (b) sodium hydroxide, absolute ethanol, reflux, 5 h; (c) urea, fusion; (d) POCl3, PCl5, reflux, 28 h; (e) aniline, absolute ethanol, room temperature.
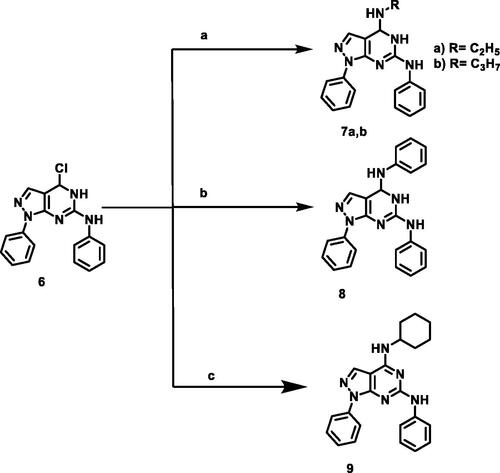
Scheme 2. Synthetic protocol of compounds 7a,b, 8, and 9. Reagents and conditions: (a) aliphatic amines, ethanol, reflux 4 h; (b) aniline, ethanol, reflux 6 h; (c) cyclohexylamine, ethanol, reflux 5 h.
Scheme 3. Synthetic protocol of compounds 10, 11a,b, 12a-c, and 13a,b. Reagents and conditions: (a) hydrazine hydrate 99%, reflux, 6 h; (b) aromatic aldehydes, ethanol, glacial acetic acid, reflux 12 h; (c) acetophenones, ethanol, glacial acetic acid, reflux 14 h.
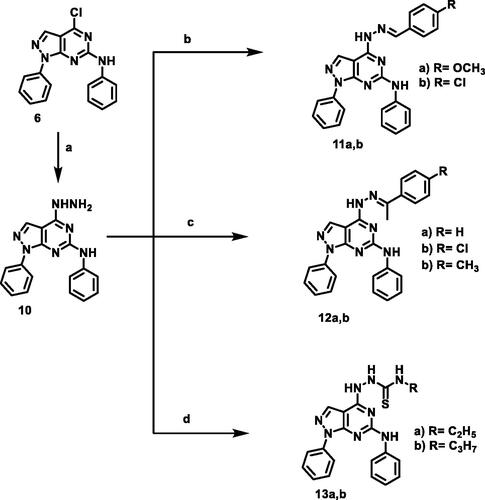
Table 1. In vitro anti-proliferative activities of the tested compounds against human lung (A549) and colon (HCT-116) cancer cell lines.
Figure 4. SAR study of the target compounds.
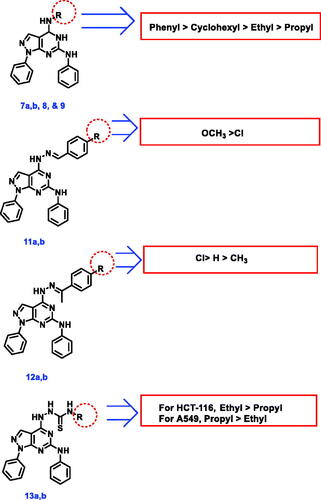
Table 2. the inhibitory activities of the tested compounds against EGFRWT and EGFRT790M kinases.
Figure 5. Flow cytometric analysis of cell cycle phases after treatment with compound 12 b.
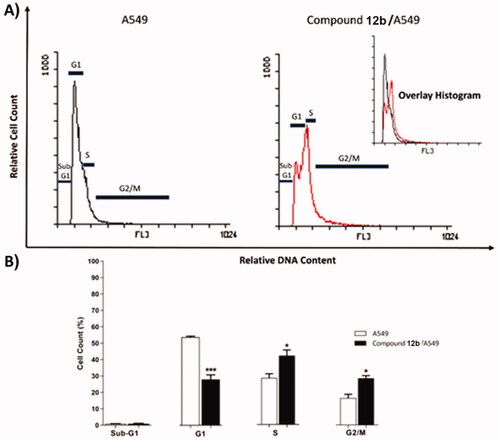
Table 3. Effect of compound 12 b on cell cycle progression in A549 cells after 48 h treatment.
Figure 6. Flow cytometric analysis of apoptosis in A549 cells exposed to compound 12 b.
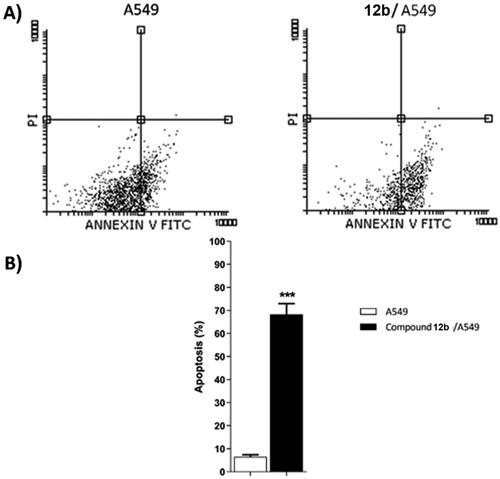
Table 4. Effect of compound 12 b on stages of the cell death process in A549 cells after 48 h treatment.
Figure 7. Gene expression analysis for the expression levels of BAX, and Bcl-2 after treatment of A549 with compound 12 b for 48 h. Normalised data are expressed as the fold changes, with the control set to ‘1’. *p < 0.05 **p < 0.01 indicate statistically significant differences from the corresponding control in unpaired t-tests.
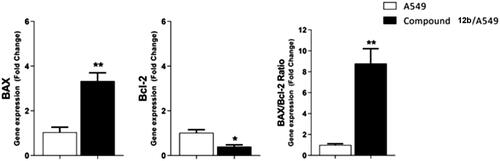
Table 5. Effect of Compound 12 b on levels of BAX, and Bcl-2 genes expression in A549 cells treated for48 h.
Table 6. In vitro cytotoxicity of 12 b and erlotinib against normal cells (WI-38).
Figure 8. Selectivity indices of compound 12 b.
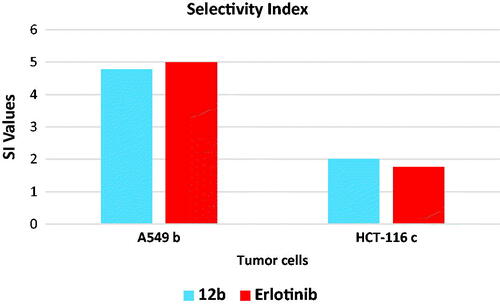
Table 7. The docking binding free energies of the synthesised compounds against EGFRWT and EGFRT790M
Figure 9. (A) Superimposition of the re-docked conformer of erlotinib (pink) over the co-crystallised conformer (green) with an RMSD value of 1.18 Å. (B) Superimposition of the re-docked conformer of TAK-285 (pink) over the co-crystallised conformer (green) with an RMSD value of 1.66 Å.
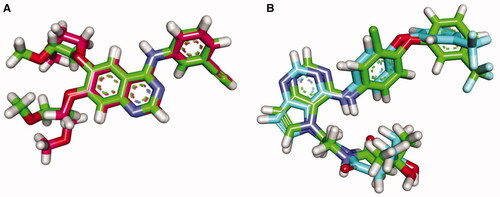
Figure 10. (A) 3D interaction of erlotinib docked into the active site of EGFRWT. The hydrogen bonds were represented in green dashed lines. The pi interactions were represented in orange lines. (B) 2D interaction of erlotinib docked into the active site of EGFRWT.
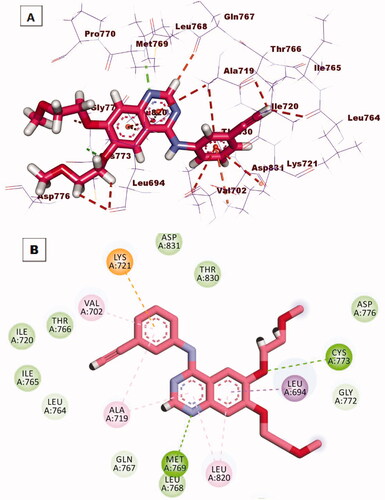
Figure 11. (A) 3 D interaction of compound 12 b docked into the active site of EGFRWT. The hydrogen bonds were represented in green dashed lines. The pi interactions were represented in orange lines. (B) 2 D interaction of compound 12 b docked into the active site of EGFRWT.
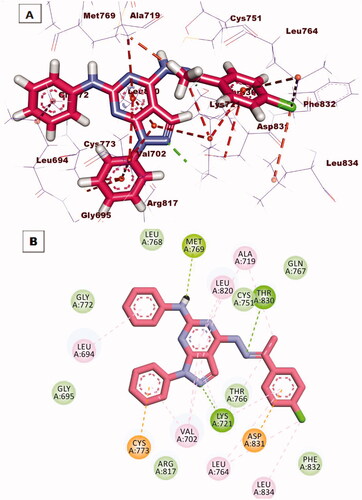
Figure 12. (A) 3 D interaction of TAK-285 docked into the active site of EGFRT790M. The hydrogen bonds were represented in green dashed lines. The pi interactions were represented in orange lines. (B) 2 D interaction of TAK-285docked into the active site of EGFRT790M.
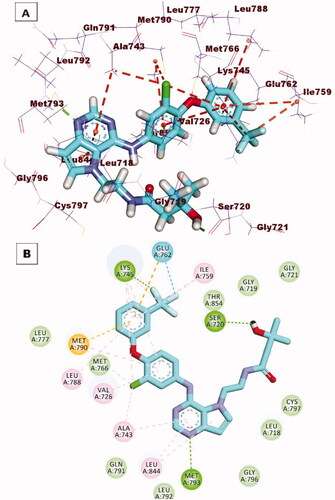
Figure 13. (A) 3 D interaction of compound 12 b docked into the active site of EGFRT790M. The hydrogen bonds were represented in green dashed lines. The pi interactions were represented in orange lines. (B) 2 D interaction of compound 12 b docked into the active site of EGFRT790M.
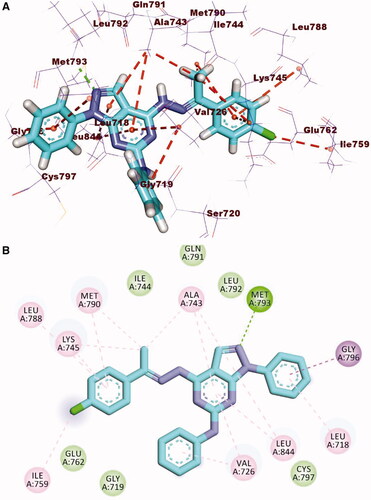
Table 8. Predicted ADMET for the designed compounds and reference drugs
Table 9. In silico toxicity studies of the synthesised compounds and erlotinib
Figure 15. values of different energy components obtained from MM-GBSA analysis. Bars represent the standard deviation values.
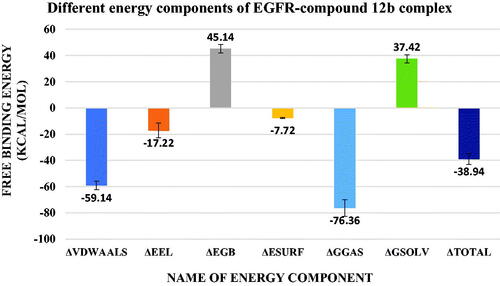
Figure 16. The decomposition of the free binding energy of amino acids around 10 Å of compound.12b.
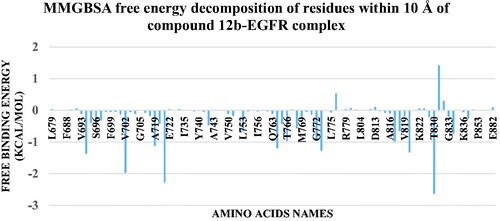
Figure 17. The 3 D interaction between compound 12 b and EGFR in each of the representative frame for each cluster. Amino acids are shown as blue sticks. compound 12 b is shown as brown sticks. Grey dashed lines: hydrophobic interaction. Blue solid lines: hydrogen bonds.
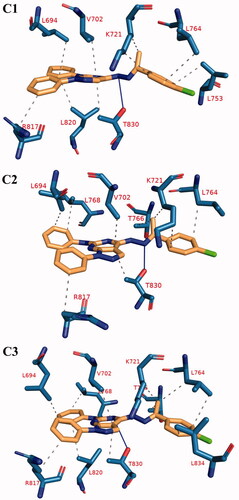
Table 10. The number and types of interactions between compound 12 b and EGFR as obtained from PLIP webserver for the representative frame of each cluster. Amino acids in bold are common in all of the clusters representative.