Figures & data
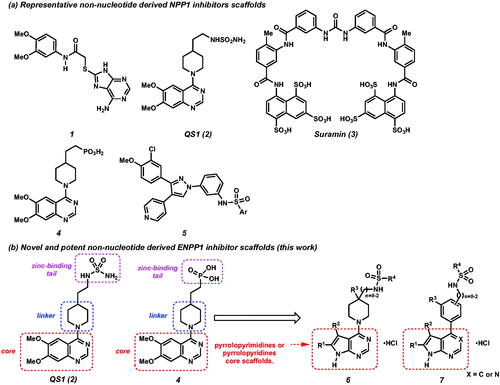
Figure 1. (a) Representative ENPP1 inhibitors. (b) Design of novel ENPP1 inhibitors possessing pyrrolopyrimidines and pyrrolopyridines core scaffolds.
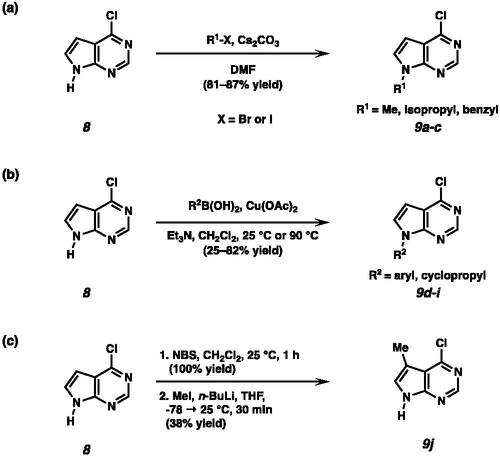
Scheme 1. (a) Synthesis of N-alkylated pyrrolopyrimidines under basic conditions. (b) Synthesis of N-aryl or N-cyclopropyl substituted pyrrolopyrimidines by Chan-Lam coupling. (c) Synthesis of 4-chloro-5-methyl pyrrolopyrimidine 9j.
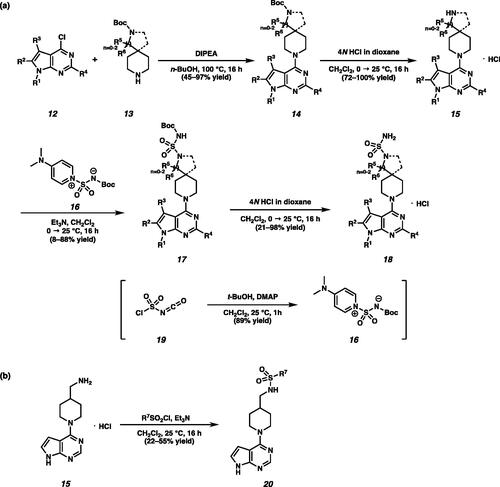
Scheme 2. (a) Synthesis of piperidine substituted sulfamides 18. (b) Synthesis of sulfone amides 20.
Scheme 3. Synthesis of phenyl substituted sulfamide 25.
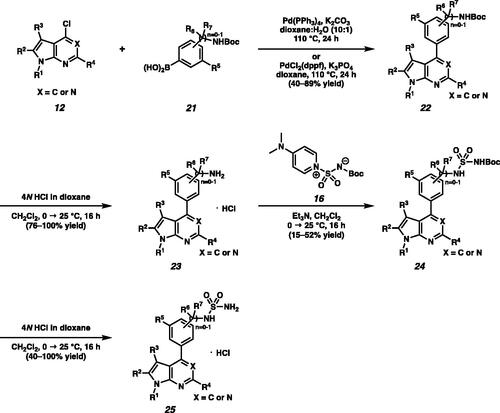
Table 1. Enzymatic inhibitory activities of 4-piperidine substituted sulfamides 18 and sulfone amides 20 against ENPP1.
Table 2. Enzymatic inhibitory activities of sulfamides 25 against ENPP1.
Figure 2. (a) Docking model of 18p bound to ENPP1. 18p (light gold) is represented in stick model and other protein domains are briefly shown in cartoon model. Two zinc (gray) and their coordinating Histidines (cyan) are shown. Several key residues interacting with 18p are shown in blue. (b) The ligand (purple) and protein (brown) were represented in ball (C: black; N: blue; O: red; Zn: cyan) and stick (bond) model, green dash shows hydrogen bonding or metal coordination. Hydrophobic intermolecular interactions are described by half whisker shapes with its amino acid residues.
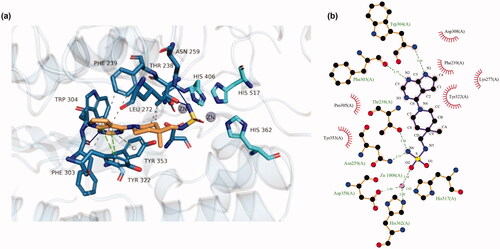
Table 3. CYP inhibition profile.
Table 4. Human, rat, and mouse liver microsomal stability of 18p (% remaining during 30 min at 1 µM).
Table 5. Pharmacokinetic properties of 18p in BALB/c mice.
Figure 3. (a) Luciferase assay for measuring ISRE-mediated reporter gene induction of 18p in THP-1 cells. THP-1 cells were stimulated by the indicated concentration of 18p for 24 h. Y-axis indicates the normalized luciferase signal by DMSO control. (b) Cell viability of 18p in THP-1 cells.
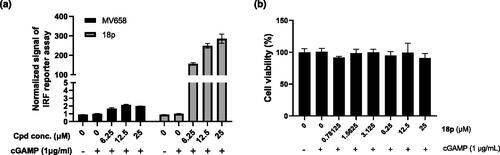
Figure 4. (a) Determination of IFN-β cytokine release by ELISA. THP-1 cells were stimulated by the indicated concentration of 18p for 8 h. (b) Determination of IP-10 cytokine secretion by ELISA. THP-1 cells were stimulated by the indicated concentration of 18p for 8 h.
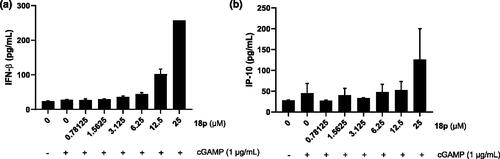
Figure 5. Real-time PCR analysis for gene expression of various interferon stimulated genes (ISG), CXCL10, OAS1, and IFITM1. THP-1 cells were stimulated by indicated concentration of 18p for 4 h. The relative gene expression level was normalized by GAPDH as an internal standard. Graphs depict mean and RQ max values.
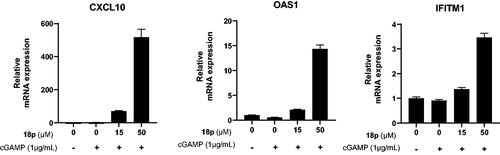
Figure 6. Western blot analysis for STING downstream signalling pathway. THP-1 cells were treated with cGAMP (1 μg/mL) first, and then treated with either DMSO or 18p at indicated concentration for 6 h. Tubulin was used as a loading control.
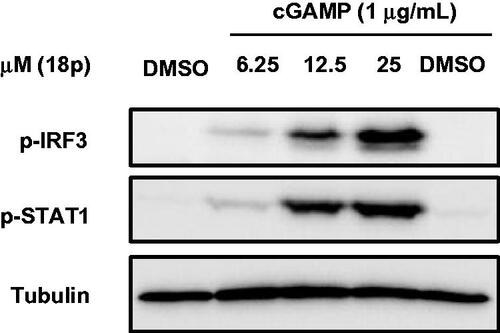
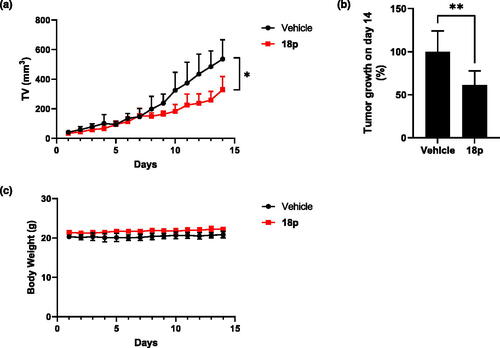
Figure 7. 4 × 10⁵ of 4T1 cells were subcutaneously inoculated into right side flank of BLAB/c mice (n = 6). Mice were orally administrated by 18p (40 mg/kg) or vehicle by every day. (a) Tumour growth curve of 18p or vehicle. X-axis indicates days after treatment. (b) Tumour growth (%) on day 14. (c) Body weight of 18p or vehicle. X-axis indicates days after treatment. Statistics for tumour volume and tumour growth were analysed by 2way ANOVA and student t-test. *p < 0.05. **p < 0.01. Graphs are depicted by mean and SD.