
Figures & data
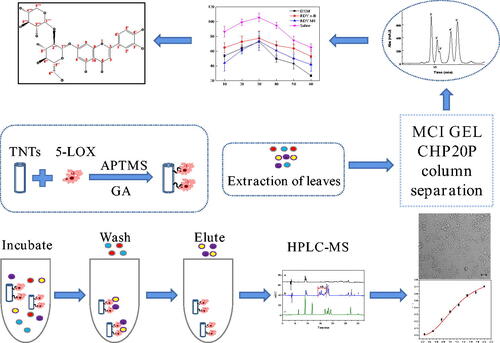
Scheme 1. Schematic diagram of experimental procedure.

Figure 1. SEM (a, b), TEM (c, d), FT-IR (e) and X-ray diffraction (f) spectra of TNTs.
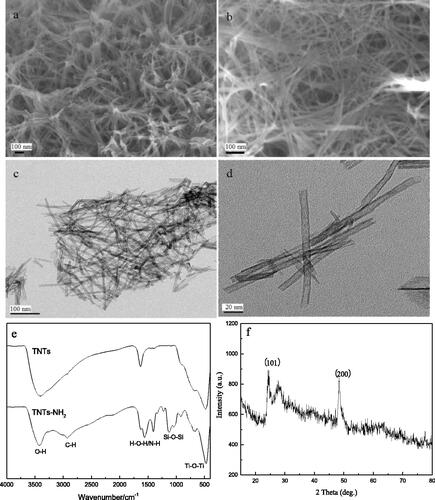
Figure 2. The influence of concentration of glutaraldehyde (a), immobilisation time (b) and amount of enzyme (c) on immobilisation.
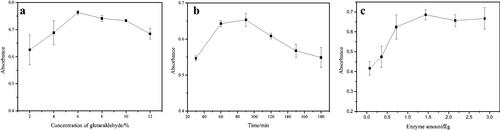
Figure 3. HPLC chromatograms of NDGA screening results using the enzyme microreactor (a: Incubation solution before screening; b: eluent of blank; c: eluent of immobilised enzyme).
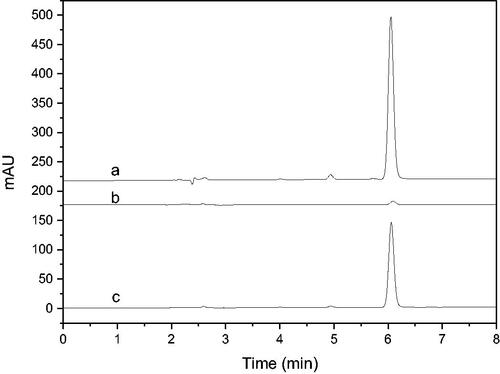
Figure 4. HPLC chromatograms of screening of 5-LOX inhibitors from LLJT (a: Eluent of blank, b: Eluent of immobilised enzyme, c: Standards using the conditions depicted in section 2.4.3 (the analytes is neochlorogenic acid, chlorogenic acid, caffeic acid, rutin, lonicerin, luteoloside, hyperin, Isochlorogenic acid C and luteolin in order.)).
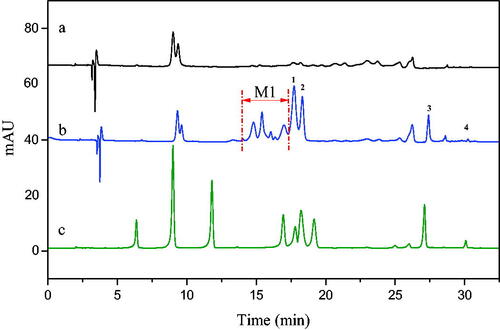
Table 1. Mass spectrometric analysis of the labelled eluents.
Table 2. The effect of active components on 5-LOX.
Figure 5. Typical HPLC chromatograms of the n-B (A) and e-a phase (B) from LLJT.
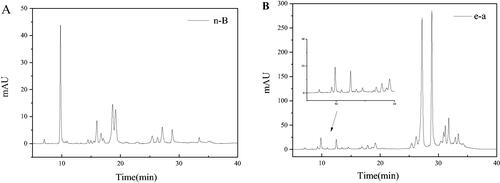
Figure 6. HPLC chromatograms of 30% (A), 40% (B), 50% (C) and 60% (D) methanol eluent.
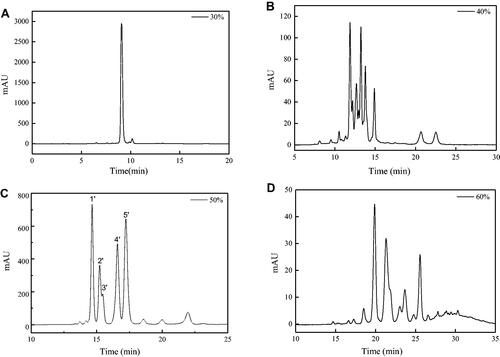
Table 3. The HPLC-MS data of compounds 1–5.
Figure 7. 1H (A) and 13 C (B) NMR, UV-vis (C) and FT-IR (D) spectra of compound 1′.
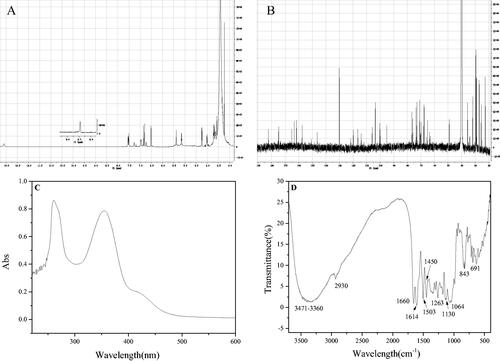
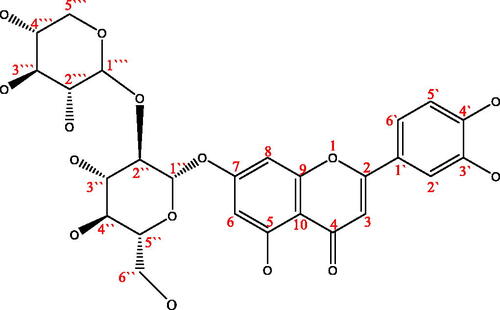
Figure 8. The structure of compounds 1′ (5,7,3′,4′-Tetrahydroxyflavone 7-O-sambubioside).
Supplemental Material
Download PDF (407.7 KB)Data availability statement
The authors confirm that the data supporting the findings of this study are available within the article and its supplementary materials.