Figures & data
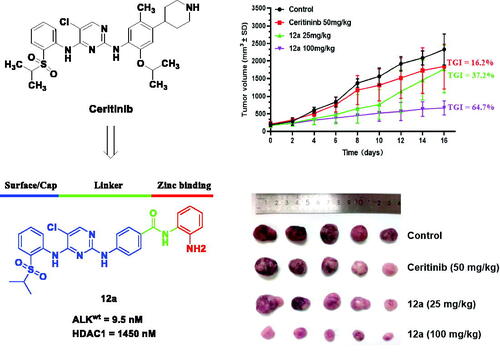
Figure 1. Chemical structures of ALK and HDACs inhibitors.
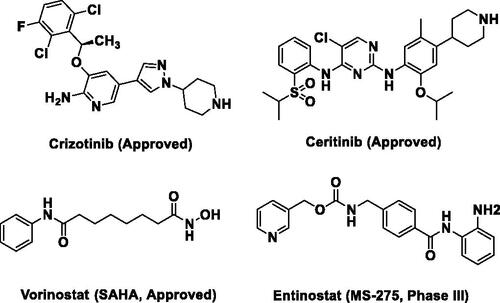
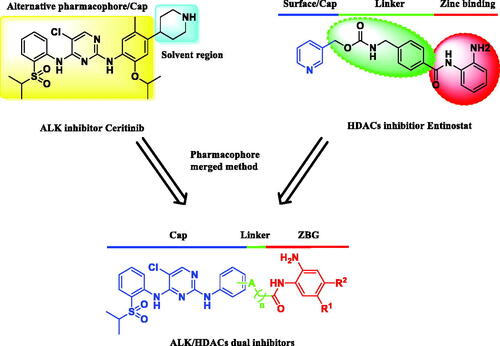
Figure 2. Design strategy for ALK/HDACs dual inhibitors.
Scheme 1. Reagents and conditions: (a) HCl, i-PrOH, 90 °C, 6 h, 52–63%; (b) Corresponding methyl alkanoates, HOBT, EDCI, DIPEA, DMF, r.t., 12 h, 24–68%; (c) NaOH, MeOH/H2O, 70 °C, 6 h, 79–93%; and (d) HOBT, EDCI, DIPEA, DMF, r.t., 5 h, 25–89%.
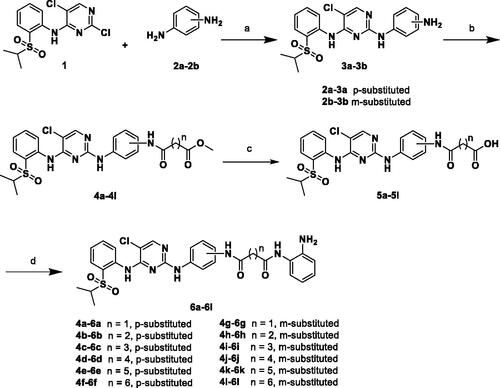
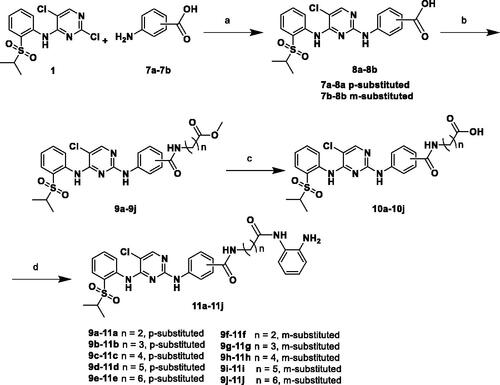
Scheme 2. Reagents and conditions: (a) HCl, EtOH, 90 °C, 6 h, 68–88%; (b) Corresponding methyl aminoalkanoates, HOBT, EDCI, DIPEA, DMF, r.t., 12 h, 47–76%; (c) NaOH, MeOH/H2O, 70 °C, 6 h, 70–89%; and (d) HOBT, EDCI, DIPEA, DMF, r.t., 5 h, 36–90%.
Scheme 3. Reagents and conditions: (a) HCl, EtOH, 90 °C, 6 h, 88%; (b) HOBT, EDCI, DIPEA, DMF, r.t., 5 h, 25–44%.
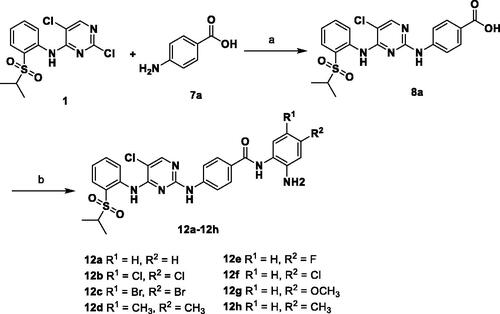
Table 1. Antiproliferative activity of compounds against cancer cell lines.
Table 2. In vitro inhibitory activity of compound 12a against cancer cell lines and enzymes.
Figure 3. Cell scratch and Transwell assays. Effect of compound 12a (1.0, 2.0 and 4.0 μM or 0.1, 0.2 and 0.4 μM), Ceritinib (1.0 μM) and Entinostat (1.0 μM) on A549 (A), H2228 (B) and SK-N-BE(2) (C) on cell migration ability. The distance was measured as the mean ± SD (n = 3). (D, E) Transwell assay results in SK-N-BE(2) and A549 cell lines treated with Ceritinib (1.0 μM) and compound 12a (1.0, 2.0 and 4.0 μM or 0.1, 0.2, and 0.4 μM) for 24 h. The number of cells was calculated as the mean ± SD (n = 3). Scale bar = 100 μm, *p < 0.05, **p < 0.01 and ***p < 0.001, compared with the control.
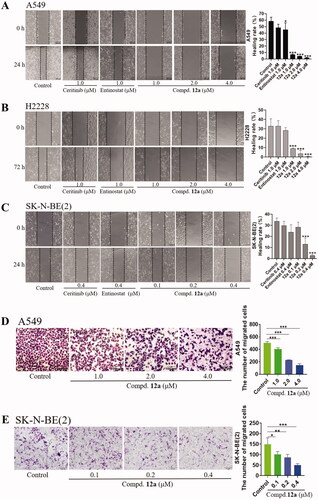
Figure 4. Effect of Compound 12a on cell cycle progression. A549 and H2228 cells were treated with, Ceritinib (1.0 μM), Entinostat (1.0 μM), compound 12a (1.0, 2.0 and 4.0 μM) and DMSO (0.8 μL) for 24 h, then stained with PI, followed by analysed via flow cytometry. The bar graph shows the percentages of cells in the G1, G2, S phases. (A) After treatment with compound 12a, the cell cycle of A549 cells was slightly blocked at S phase, compared with the positive groups or control. (B) The cell cycle was arrested at G1 phase after being treated with compound 12a, vs. control in H2228 cells.
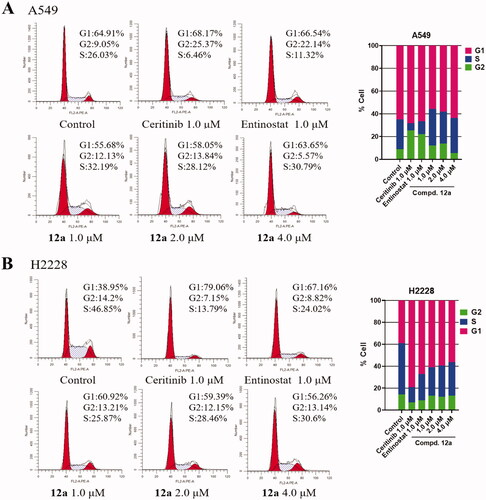
Figure 5. Compound 12a induced apoptosis in A549 and H2228 cell lines. A549 and H2228 cells were treated with Ceritinib (1.0 μM), Entinostat (1.0 μM), compound 12a (1.0, 2.0 and 4.0 μM) for 24 h, followed by stained with AO/EB (A and C) or Hoechst 33258 (B and D), and photographed. Scale bar = 100 μm. (E and F) Flow cytometry analysis results. A549 and H2228 cells (E) cells were treated with compound 12a or positive drugs for 48 h, then stained with Annexin V-FITC/PI.
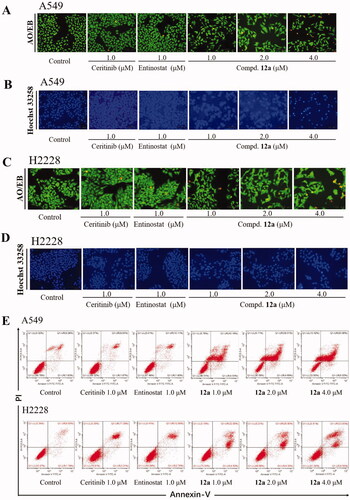
Figure 6. Effect of compound 12a on the protein expression of ALK- and HDAC-mediated signalling pathways in A549 and H2228 cell lines. (A, B) Western blot analysis of apoptosis-associated and ALK protein expression after treated with compound 12a in A549 (A) and H2228 (B) cell lines. (C, D) Western blot analysis of Ac-H3 and H3 protein expression after treated with compound 12a in A549 (C) and H2228 (D) cell lines. All data were expressed as the mean ± SD of three independent experiments. *p < 0.05, ***p < 0.001 compared with untreated samples.
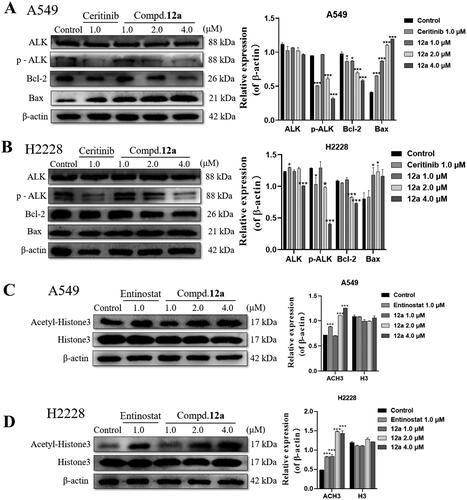
Figure 7. Effect of compound 12a on the growth of SK-N-BE(2) xenografts in vivo. Nude mice were injected with SK-N-BE(2) cells, followed by treatment with compound 12a (25 mg/kg and 100 mg/kg) and Ceritinib (50 mg/kg) for 16 days. (A) Tumour volume curves. (B) Bodyweight of mice. (C) Tumour weight. (D) Images of tumour xenografts excised from mice model. ***p < 0.005, compared with the control. (E) H&E staining of the organs from the model, control, low-dose and high-dose experimental groups.
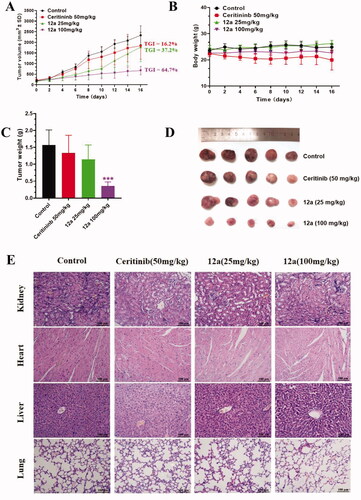
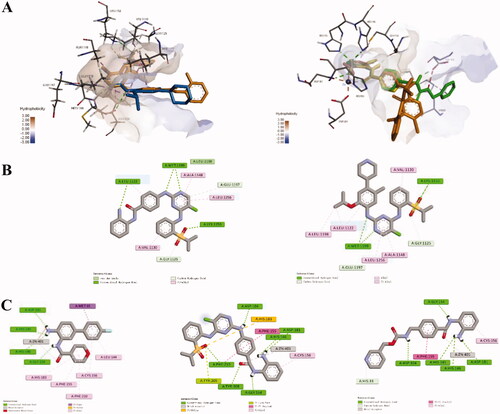
Figure 8. (A) Overlap modelling of 12a (orange) and Ceritinib (blue) in ALK (PDB: 4MKC) (left); Overlap modelling of 12a (orange), Entinostat (green) and original ligand (yellow) in HDAC2 (PDB: 5IWG) (right). (B) 2D diagram of the interactions of 12a (left) and Ceritnib (right) with ALK. (C) 2D diagram of the interactions of original ligand (left), 12a (middle) and Entinostat (right) with HDAC2.