Figures & data

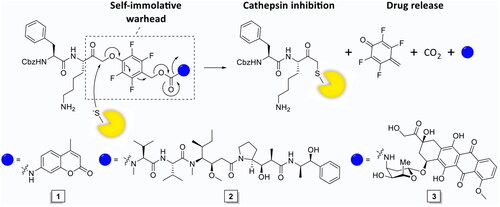
Figure 1. The mechanism of action of the self-immolative warhead and structures of IPD-AMC (1), IPD-MMAE (2), and IPD-Dox (3). In short, nucleophilic attack on the phenoxymethyl ketone results in cathepsin inhibition followed by self-immolation and payload release.
Scheme 1. Synthesis of inhibitory prodrug model 1 (IPD-AMC). Reagents and conditions: a) HBTU, DiPEA, DMF, r.t., quant.; b) LiOH·H2O, THF/MeOH/H2O, r.t., 1 h, quant.; c) i. N-methyl morpholine, isobutyl chloroformate, THF, -15 °C, 30 min, ii. CH2N2 in Et2O, THF, -15 °C, 3 h, iii. HCl/AcOH, -15 °C, 10 min, 85% over 3 steps; d) 9, KF, DMF, 70 °C, 16 h, 80%; e) 20% phosgene in toluene, reflux, 16 h; f) i. isocyanate 12, dibutyltin diluarate (5 mol%), THF, r.t., 16 h., ii. TFA/DCM, r.t., 30 min, 25% over 2 steps.
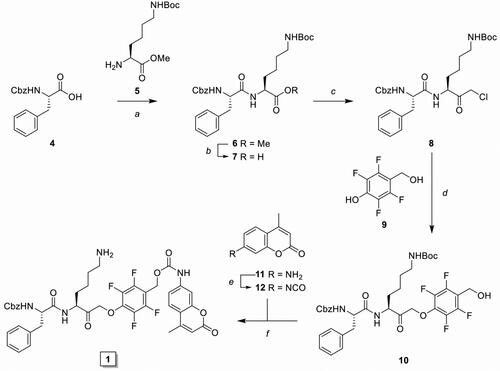
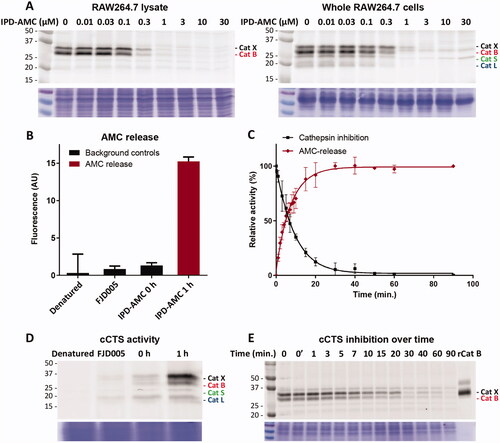
Figure 2. Cathepsin inhibition and AMC release by IPC-AMC. A) RAW264.7 lysate (corresponding to 2·105 cells) or live RAW264.7 cells (2·105 cells) were incubated with indicated concentration of IPD-AMC (1 h, 37 °C) after which residual cathepsin activity was labelled with BMV109 (1 µM, 1 h, 37 °C). Cells were lysed and proteomes were separated by SDS PAGE. Cathepsin labelling was visualised by in-gel fluorescence scanning (N = 2, n = 2). B) AMC release from IPD-AMC (2.5 µM) in RAW264.7 lysate is blocked after deactivating the lysate by denaturation (5 min, 95 °C) or inhibition of cCTSs by inhibitor FJD005 (10 µM, 5 min, 37 °C) (n = 3). C) AMC release correlates with cathepsin inhibition over time as determined by in tandem competitive labelling with BMV109. This indicates immediate AMC release following cathepsin inhibition at the observed time-scale (n = 3). D) In tandem (c)ABPP for experiment B: RAW264.7 lysate was either pre-treated by denaturation (95 °C, 5 min) or inhibition with inhibitor FJD005 (10 µM, 37 °C for 5 min), followed by labelling with BMV109. BMV109 in RAW264.7 lysate (at t = 0) serves as background control. E) In tandem cABPP for experiment C: RAW264.7 lysate was treated with IPD-AMC (2.5 µM) for the indicated time points after which reaction was quenched by addition of BMV109 (25 µM, final conc.). The lysate was cleared by centrifugation, the proteome separated by SDS PAGE and fluorescent labelling was visualised by in gel fluorescent scanning. Coomassie staining was used to determine equal protein loading.
Scheme 2. Synthesis of inhibitory prodrug 2 (IPD-MMAE) and 3 (IPD-Dox). Reagents and conditions: a) i. TSTU, DiPEA, DMF, 0 °C, 1 h; ii. 11, r.t., 16 h, 92%; b) i. N-methyl morpholine, isobutyl chloroformate, THF, -15 °C, 15 min, ii. CH2N2 in Et2O, THF, -15 °C, 3 h, iii. HCl/AcOH, -15 °C, 10 min, 80% over 3 steps; c) 9, KF, DMF, 60 °C, 3 h, 79%; d) 17, DMAP, DCM, -20 °C to r.t., 4 h, 99%; e) i. MMAE, HOBt, Pyridine, DMF, r.t., 48 h, ii. Pd(PPh3)4, DMBA, DCM, 15 min, r.t., 71% over 2 steps; f) i. Doxorubicin, DiPEA, DMF, r.t., 48 h, ii. Pd(PPh3)4, DMBA, DCM, 15 min, r.t., 59% over 2 steps.
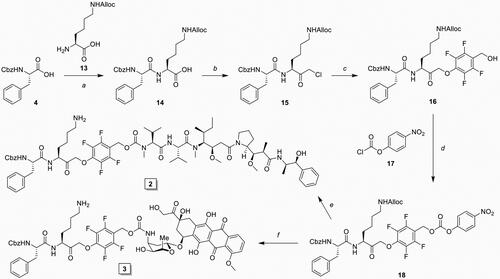
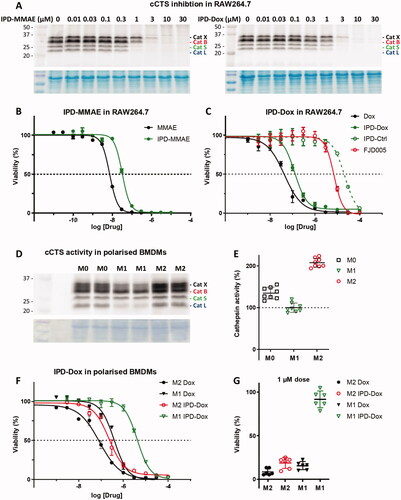
Figure 3. Inhibitory profile and cell killing of cytotoxic IPDs IPD-MMAE and IPD-Dox. A) Live RAW264.7 cells were incubated with indicated concentration of IPD-MMAE and IPD-Dox (1 h, 37 °C), followed by labelling with BMV109 (1 µM, 1 h, 37 °C). Proteomes were separated by SDS PAGE and visualised by in-gel fluorescence scanning (n = 2). Coomassie staining was used to determine equal protein loading. B, C) RAW264.7 cells were treated with indicated concentration of cytostatic drug or IPD for 3 days, after which cell viability was assessed by MTT assay (N = 3, n = 2). D) Bone marrow-derived macrophages were polarised into M0, M1 or M2 subsets and relative cathepsin activity was determined by labelling with BMV109 (1 µM, 1 h, 37 °C) (n = 8). Coomassie staining was used to determine equal protein loading. E) Quantification of experiment D. F) M1 and M2 BMDMs were treated with indicated concentrations of doxorubicin or IPD-Dox for 3 days, after which cell viability was assessed by MTT assay. M2 macrophages display higher sensitivity towards doxorubicin (some 4-fold) com-pared to M1 macrophages and IPD-mediated delivery increases this selectivity (some 18-fold) (n = 6). G) M2-selective killing by IPD-Dox can be achieved at 1 µM concentration in vitro (n = 6).