
Figures & data
Figure 1. Chemical structures of recently reported small-molecule Keap1-Nrf2 PPI inhibitors.
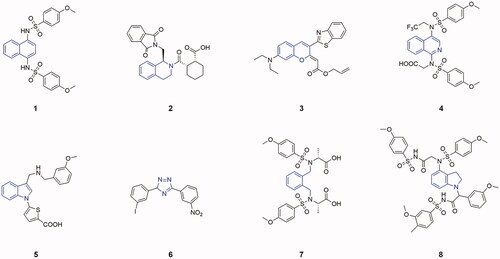
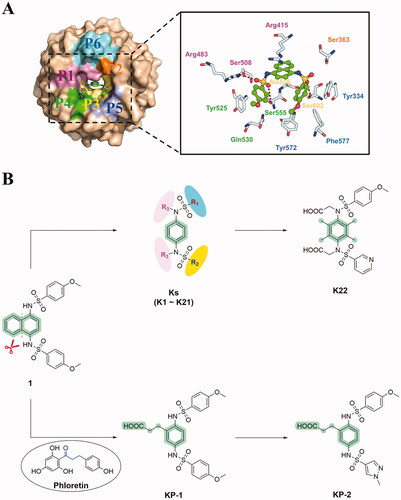
Figure 2. Design of novel non-naphthalene derivatives from compound 1. (A) Crystal structure of compound 1 bound to Keap1 Kelch domain (PDB ID: 4IQK). (B) The design strategy of novel non-naphthalene scaffold-based derivatives.
Scheme 1. Synthetic routes of compounds K1–K22. Reagents and conditions: (a). Different sulphonyl chloride (2.5 equiv.), CH2Cl2, pyridine, rt, 6–18 h; (b). Different sulphonyl chloride (1.2 equiv.), CH2Cl2, Et3N, rt, 6–16 h; (c). 4-Methoxybenzenesulfonyl chloride (1.2 equiv.), THF, Et3N, rt, 5–10 h; (d). Ethyl bromoacetate (2.2 equiv.), DMF, K2CO3 (3 equiv.), rt, 16 h; (e). Methanol, 10% NaOH, 85 °C, 5 h; (f). Pyridine-3-sulphonyl chloride (1.2 equiv.), pyridine, THF, rt, 18 h; (g). Ethanol, 10% NaOH, 80 °C, 8 h.
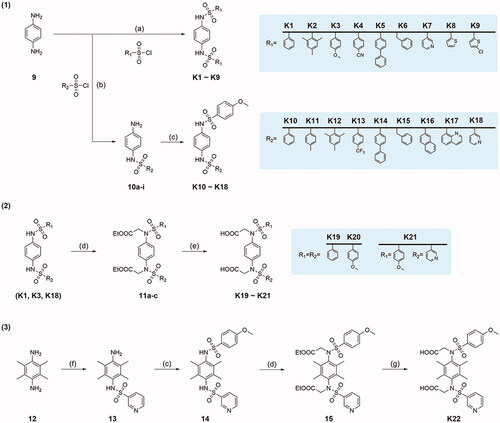
Scheme 2. Synthetic routes of compounds KP-1 and KP-2. Reagents and conditions: (a). Iron powder (4.5 equiv.), HCl (conc.), ethanol, 80 °C, 2 h; (b). 4-Methoxybenzenesulfonyl chloride (2 equiv.), THF, Et3N, rt, overnight; (c). Benzyl acrylate (10 equiv.), palladium (II) acetate (0.1 equiv.), XPhos (0.2 equiv.), N, N-diisopropylethylamine (2 equiv.), DMF, 100 °C, 24 h; (d). 10% Palladium on charcoal, ethanol, H2, rt, 16 h; (e). 1-Methyl-1H-pyrazole-4-sulphonyl chloride (1.1 equiv.), THF, pyridine, rt, 8 h; (f). 4-Methoxybenzenesulfonyl chloride (1.1 equiv.), CH2Cl2, Et3N, rt, 10 h.
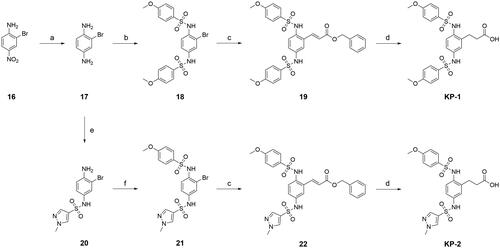
Figure 3. Inhibitory activities of derivatives K1–K18 against Keap1-Nrf PPI by FP assay. (A) Inhibitory rates of K1–K9 towards Keap1-Nrf2 PPI at 5 μM and 50 μM. (B) Binding mode of K3 with Keap1 using molecular docking. (C) Inhibitory rates of K10–K18 towards Keap1-Nrf2 PPI at 5 μM and 50 μM. (D) Binding mode of K18 with Keap1 using molecular docking.
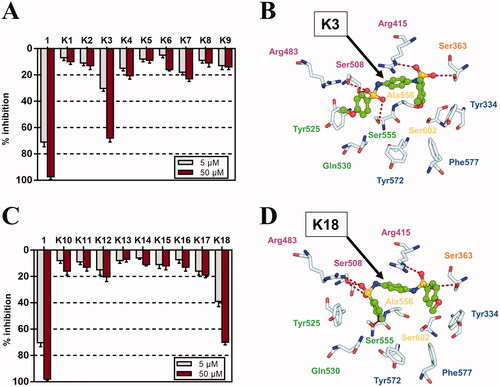
Figure 4. Dose-response curves, metabolic stability and co-immunoprecipitation analysis of representative compounds. (A) Dose-response curves of compound 1, Phloretin (PHL), K20–K22, KP-1 and KP-2 for inhibition of Keap1-Nrf2 PPI in FP assay; (B) Metabolic stability of compound 1, PHL, K22 and KP-2 in human liver microsomes; (C) Co-immunoprecipitation assay for Nrf2.
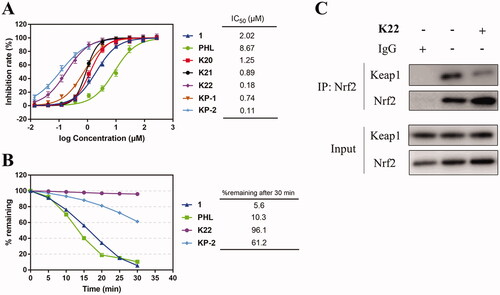
Figure 5. Preliminary structure-activity relationships of non-naphthalene scaffold-based derivatives.
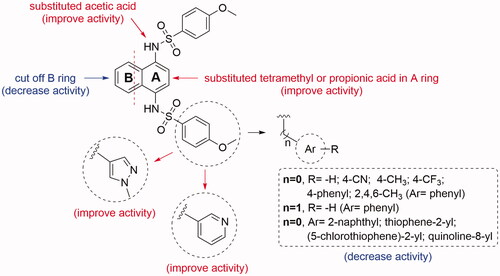
Figure 6. Molecular modelling of compound K22 in the binding pocket of Keap1. (A) The root-mean-square deviations (RMSDs) of the backbone atoms (Cα) of Keap1 and heavy atoms of K22. (B) Key residues for the binding of K22 to Keap1. (C) Overview of K22 bound to Keap1. (D) Detailed view of K22 bound to Keap1.
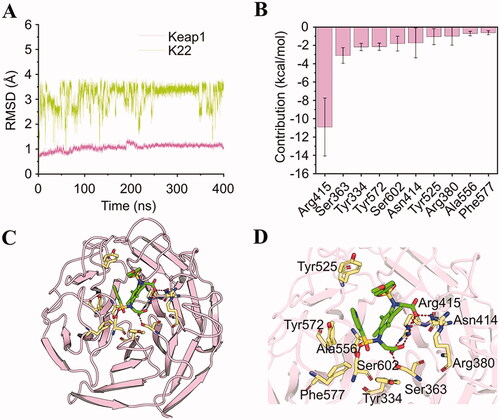
Figure 7. Nrf2 activation effect of K22 on H9c2 cells. (A) Cells were treated with K22 at various concentrations for 12 h. (B) Cells were exposed to K22 (10 μM) at various time points. qRT-PCR assay was applied to analyse the mRNA levels of Nrf2 and Nrf2-targeted gene. GAPDH was used to normalise the expression of these genes with DMSO-treatment group used as the blank control. (C) Cells were treated with K22 at various concentrations for 12 h. (D) Cells were exposed to K22 (10 μM) at various time points. Western blot assay was applied to determine the protein levels of Nrf2 and Nrf2-regulated proteins. (E&F) Statistics of the protein expression levels of Nrf2, HO-1 and NQO1. GAPDH was used as the internal control. Data are presented as mean ± SEM. *P < 0.05, **P < 0.01, ***P < 0.001 vs. Control group.
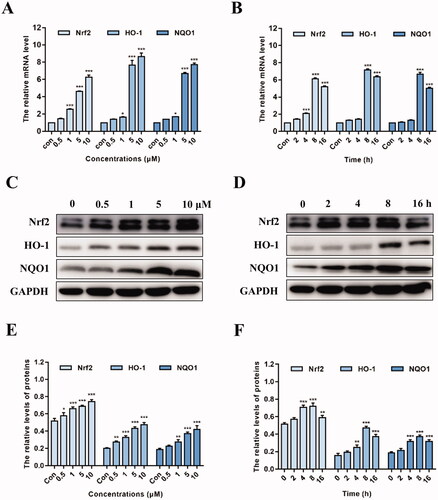
Figure 8. The expression levels of Nrf2 and Nrf2-regulated genes after treatment with Nrf2 siRNA and K22. H9c2 cells were incubated with Nrf2 siRNA (50 nM), K22 (10 μM), or Nrf2 siRNA (50 nM) plus K22 (10 μM). qRT-PCR was then used to quantify the expression levels of Nrf2, HO-1 and NQO1 genes. ***p < 0.001.
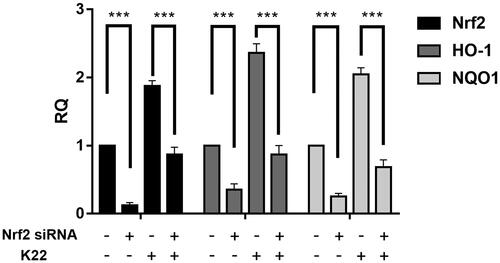
Figure 9. Effects of K22 on LPS-induced injury in H9c2 cells. (A) Protective effects of K22 on the LPS-induced cell damage. Cells were pre-treated with K22 (0.5–10 μM) for 12 h and then with LPS (1 μg/mL) for another 12 h. The cell viability was determined by MTS assay. (B–D) Cells were pre-treated with K22 (1–10 μM) for 12 h and then exposed to LPS (1 μg/mL) for another 12 h, and the ratios of IL-6 (B), TNF-α (C) and IL-1β (D) were determined by corresponding ELISA kits, respectively. (E–G) K22 inhibited LPS-induced ROS generation in H9c2 cells. Cells were pre-treated with 10 μM K22 for 12 h and then exposed to LPS (1 μg/mL) for another 12 h. The cells were stained with 10 μM DCFH-DA for 30 min at 37 °C in dark conditions and the fluorescence signals were detected by a flow cytometer. (H) Statistics of ROS levels in H9c2 cells. Data are presented as mean ± SEM. **P < 0.01, ***P < 0.001 vs. Control group.
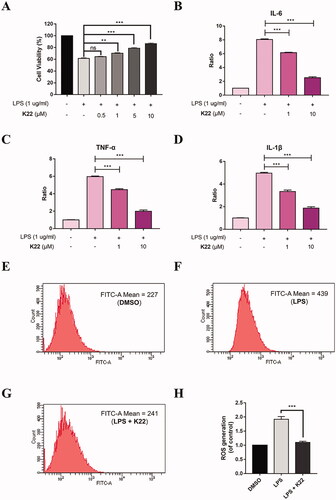
Table 1. Drug-likeness properties of compounds 1, 4, K22 and KP-2.