
Figures & data
Figure 1. Structures of SLC-0111, some reported CAIs I–VI and design of target sulphonamides, Series I (3a–c, 5a–d, and 7a–e) and Series II (9, 11a,b, 13a–e, and 15a,b).
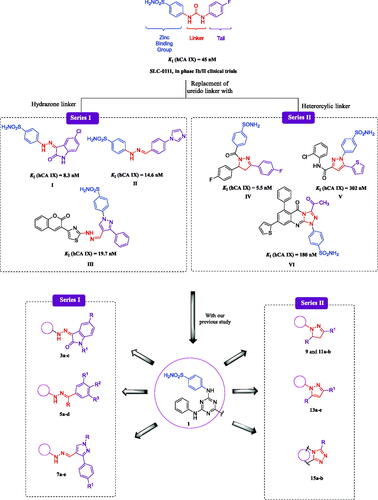
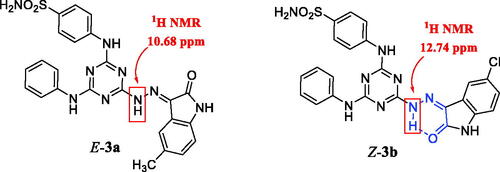
Figure 2. The E-isomer of compound 3a and Z-isomer of compound 3b with the pseudo-six-membered ring (in blue color).
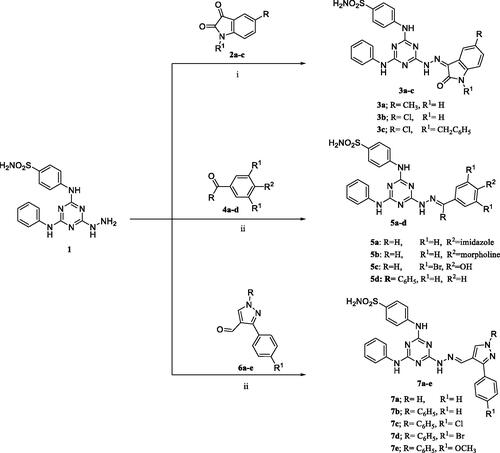
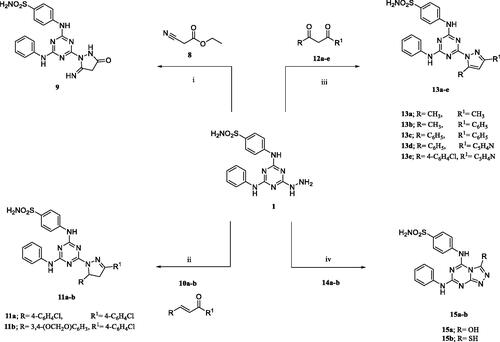
Scheme 1. Synthetic pathway of new sulphonamides analogues 3a–c, 5a–d, and 7a–e.
Scheme 2. Synthetic pathway of target sulphonamides 9, 11a,b, 13a–e, and 15a,b.
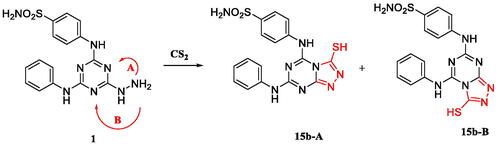
Scheme 3. The two proposed isomers of compound 15b when refluxed with CS2 in pyridine.
Scheme 4. A plausible mechanism for the formation of one of the two isomers regarding analogue 15b.Citation31,Citation32
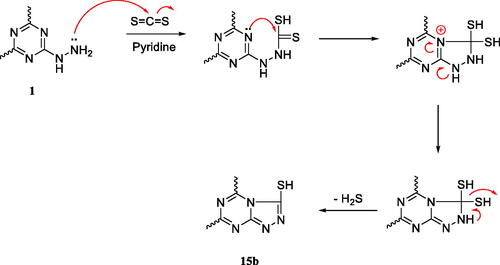
Table 1. Inhibition profile concerning human CA isoforms, off-target isoforms (hCA I and II), and the tumour-associated isoforms (hCA IX and XII) with triazine-based benzenesulfonamides 3a–c, 5a–d, 7a–e, 9, 11a,b, 13a–e, 15a,b, besides the standard inhibitors acetazolamide (AAZ) and SLC-0111 by a stopped-flow CO2 hydrase assay. 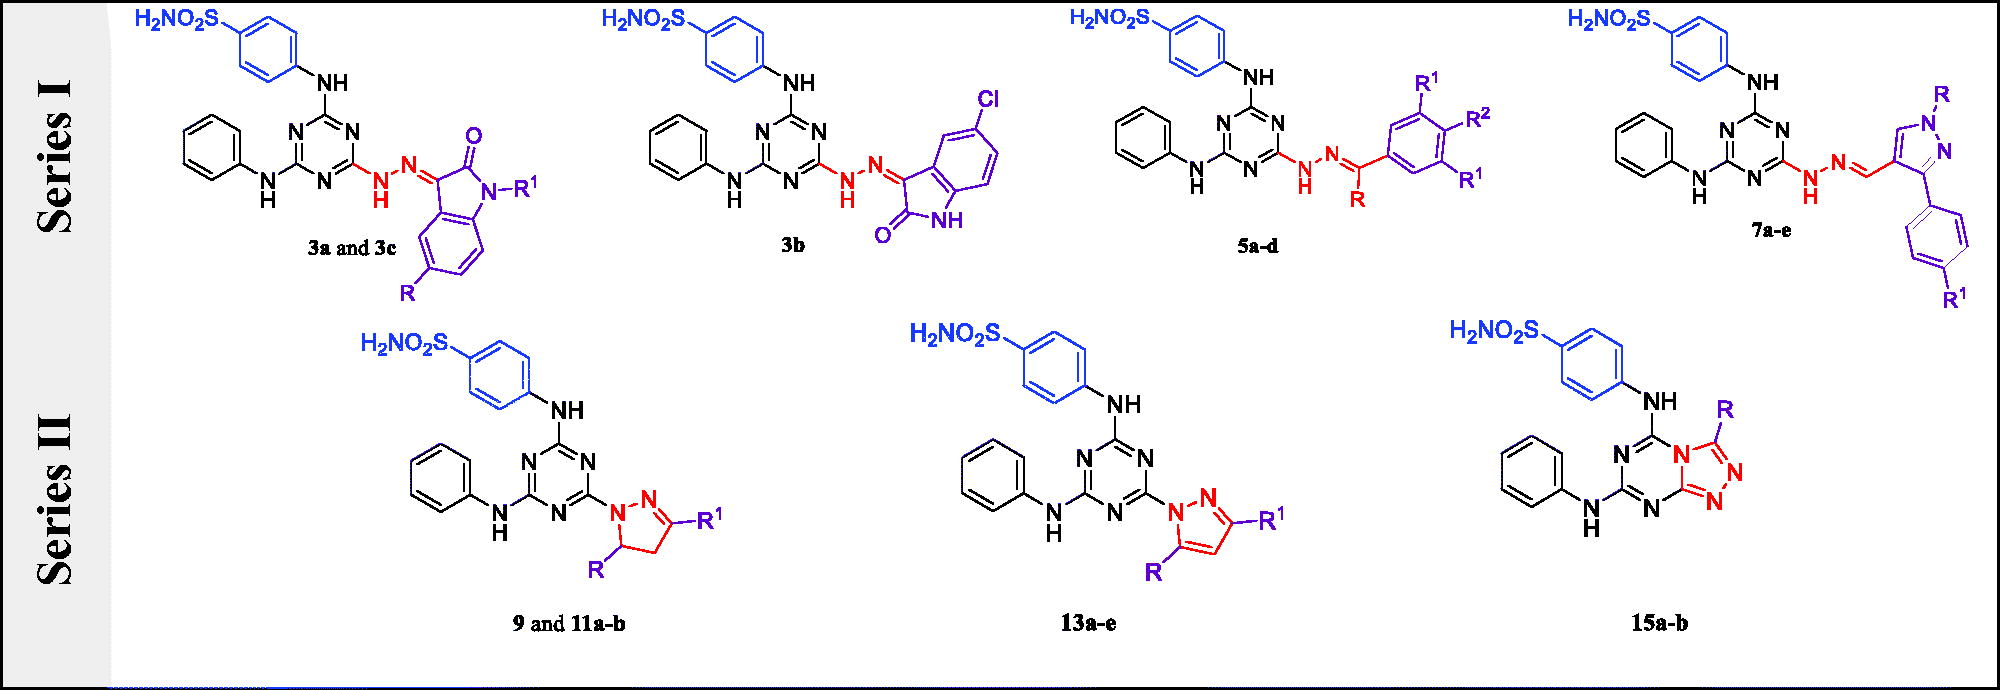
Table 2. Selectivity ratios for the inhibition of hCA IX and XII over hCA I and II for target compounds 3a–c, 5a–d, 7a–e, 9, 11a,b, 13a–e, 15a,b and the standard inhibitors acetazolamide (AAZ) and SLC-0111.
Table 3. Sixty human tumour cell lines in vitro subpanel at a concentration of 10 µM for the presence of compounds 3a, 5 b–d, 7c,d, 11a,b, and 13 b–e.
Table 4. Five doses of in vitro anticancer activity results aagainst all sixty cancer cell lines expressed as GI50b (μM), TGIc (μM), and LC50d (μM) for compounds 5c and 13c.
Figure 3. GI50-MID and average sensitivity of all cell lines (µM) of 5c (blue), and 13c (orange), in comparison to 5-FU (grey).

Table 5. Selectivity ratios of the analouges 5c and 13c in comparison to 5-FU towards nine tumours.
Table 6. Cytotoxic activities of compounds 5d and 13c against MCF7 (breast cancer), and NCI-H460 (lung cancer) under hypoxia compared to 5-FU.
Table 7. Anti-proliferative activity of compound 13c and 5-FU against normal human cells.
Figure 4. Compound 13c reduces the migratory capacities of NCI-H460 cells versus control. (A) Effect of negative control on wound healing, (B) Effect of compound 13c on wound healing, and (C) Quantitative analysis of the percentage of mobility inhibition rate. The values are the mean ± SD of three experiments.
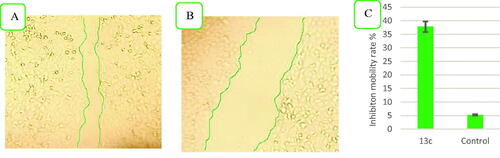
Figure 5. The influence of compound 13c on the clonogenicity of NCI-H460. (A) Effect of negative control on clonogenicity of NCI-H460 cells, (B) Effect of compound 13c on clonogenicity of NCI-H460 cells, and (C) Quantitative analysis of the colony number. The values are the mean ± SD of three experiments.
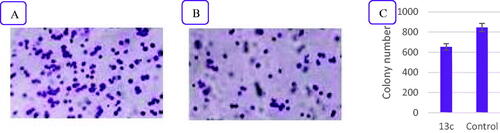
Figure 6. Effect of compound 13c (right panel) and DMSO (left panel) on the proportion of annexin V-FITC-positive staining in NCI-H460 cells during an apoptosis experiment. The four quarters were designated as LL for viable, LR for early apoptosis, UR for late apoptosis, and UL for necrotic.
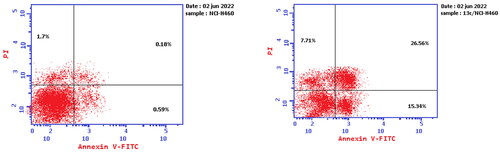
Figure 7. The percentage of NCI-H460 cells stained positively for annexin V-FITC in the apoptosis assay is affected by compound 13c and DMSO. The values are the mean ± SD of three experiments.
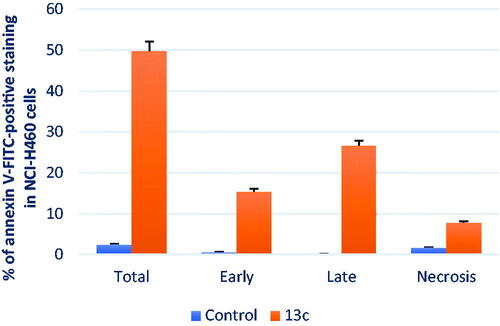
Figure 8. Cell cycle analysis of compound 13c (left panel) and DMSO (right panel)-treated NCI-H460 cells (right panel).
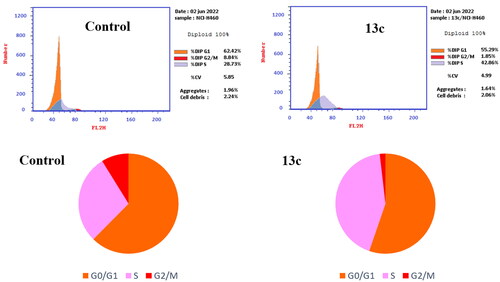
Figure 9. Docking of compounds 5d and 13c within the active site of hCA IX (PDB, ID: 3IAI). (A and C) The 3D binding mode of compounds 5d and 13c with hCA IX. The analogues 5d and 13c are coloured in cyan. The surrounding residues in the binding pocket are coloured in yellow. The hydrogen bond is depicted as a magenta dashed line. (B and D) The surface binding mode of hCA IX with compounds 5d and 13c viewing large cavity size in the active site filled with two bulky phenyl rings attached to hydrazone linker in 5d and pyrazole linker in 13c.
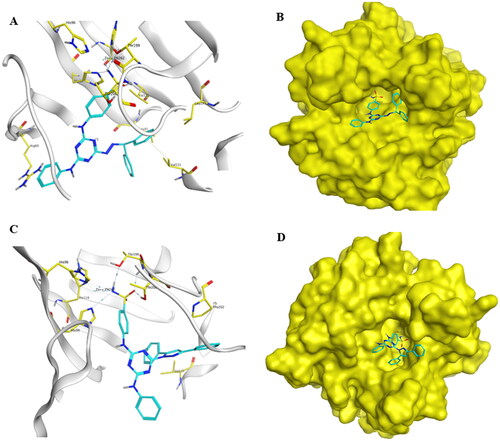
Table 8. Outcomes for docking of target compounds, 5d and 13c in the hCA IX active site (PDB, ID: 3IAI).
Table 9. Calculated binding free energy of the compound 5d (kJ/mol).