
Figures & data
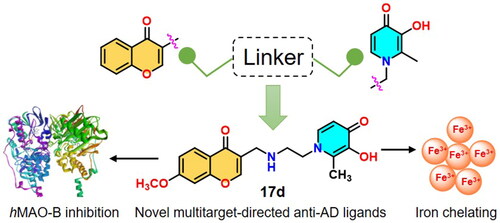
Figure 1. Representative dual-targeting anti-AD agents.
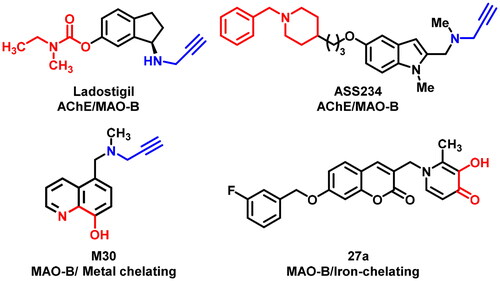
Figure 2. Representative dual-targeting anti-AD agents.
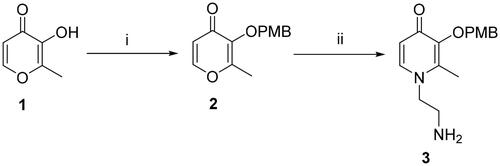
Scheme 1. Reagents and conditions: (i) 4-Methoxybenzyl chloride, K2CO3, acetone, reflux, 3–8 h. (ii) Ethane-1,2-diamine, Ethanol: H2O = 1:1, 70 °C, 1.5 h.
Scheme 2. Reagents and conditions: (i) POCl3, DMF, −10 °C, 15 h. (ii) NH2SO3H, NaClO2, 0 °C, 12 h. (iii) POCl3, DMF, 3, r.t., 10 h. (iv) BCl3, anhydrous DCM, −48 °C to r.t., 12 h.
Scheme 3. Reagents and conditions: (i) POCl3, DMF, −10 °C 15 h. (ii) Acetyl chloride, Triethylamine, anhydrous DCM, 0 °C to r.t., 3 h. (iii) NH2SO3H, NaClO2, 0 °C, 12 h. (iv) Oxalyl chloride, DMF, anhydrous DCM, 3, r.t., 3 h. (v) K2CO3, acetonitrile: H2O = 1:1, reflux, 0.5 h. (vi) corresponding substituted benzyl bromide, K2CO3, DMF, 12 h (vi) BCl3, anhydrous DCM, −48 °C to r.t., 12 h.
Scheme 4. Reagents and conditions: (i) 4-Methoxybenzyl chloride, K2CO3, acetone, reflux, 3–8 h. (ii) Ethane-1,2-diamine, Ethanol: H2O = 1:1, 70 °C, 1.5 h.
Table 1. Physicochemical parameters for compounds 8a–e, 15a–g, and 17a–l.
Figure 3. Rational design of chromone-pyridinone hybrids as potential anti-AD agents.
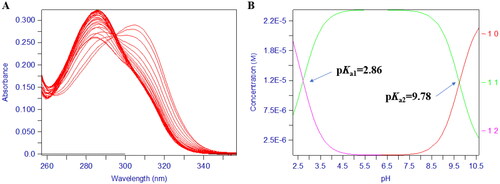
Figure 4. The pH-dependent UV spectra of compound 17d. (A) The pH-dependence of the spectrum of compound 17d in the presence of Fe3+ over the pH range 0.8–2.1 in 0.1 M KCl at 25 °C, [Fe3+] = 1.0 μM, [17d] = 1.1 μM. (B) The pH-dependence of the spectrum of compound 17d in the presence of Fe3+ over the pH range 2.1 and 9.0 in 0.1 M KCl: DMSO = 3:2 (v/v) at 25 °C, [Fe3+] = 1.0 μM, [17d] = 5.0 μM. C. Speciation plot of Fe3+/17d as measured by the percentage formation relative to [Fe3+]total as a function of pH. This plot was calculated from the affinity constants reported in and the Fe3+ hydrolysis constants were as follows: FeOH = –2.563, Fe (OH)2 = –6.205, Fe (OH)3 = –15.100, Fe2 (OH)2 = –2.843, Fe3 (OH)4 = –6.059, and Fe (OH)4 = –21.883.
![Figure 4. The pH-dependent UV spectra of compound 17d. (A) The pH-dependence of the spectrum of compound 17d in the presence of Fe3+ over the pH range 0.8–2.1 in 0.1 M KCl at 25 °C, [Fe3+] = 1.0 μM, [17d] = 1.1 μM. (B) The pH-dependence of the spectrum of compound 17d in the presence of Fe3+ over the pH range 2.1 and 9.0 in 0.1 M KCl: DMSO = 3:2 (v/v) at 25 °C, [Fe3+] = 1.0 μM, [17d] = 5.0 μM. C. Speciation plot of Fe3+/17d as measured by the percentage formation relative to [Fe3+]total as a function of pH. This plot was calculated from the affinity constants reported in Table 1 and the Fe3+ hydrolysis constants were as follows: FeOH = –2.563, Fe (OH)2 = –6.205, Fe (OH)3 = –15.100, Fe2 (OH)2 = –2.843, Fe3 (OH)4 = –6.059, and Fe (OH)4 = –21.883.](/cms/asset/43bf30e7-dbaf-4ef4-b690-26d10e86f00c/ienz_a_2134358_f0004_c.jpg)
Figure 5. Kinetic study and cytotoxicity assay of compound 17d. Mode of MAO-B inhibition saturation curves (A) and Lineweaver − Burk plot (B) of the inhibition of MAO-B enzyme by different concentrations of 17d (0, 33.3, 100, and 300 nM) in the presence of p-tyramine (0.05, 0.1, 0.25, 0.5, 1.0, and 1.25 mM) as a substrate. The Cytotoxicity effect of compound 17d on PC-12 cells (C).
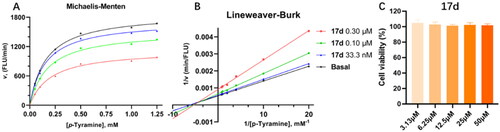
Table 2. The hMAO-B inhibitory activities of compounds.
Table 3. IC50 and SI for the chromone derivatives on the enzyme activity of MAO isoforms.
Table 4. Predicted drug-like properties and PAMPA-BBB results for 17a and 17d.
Figure 6. Best docking poses of compound 17d at the active site of MAO-B. The most relevant interacting residues are presented in green carbons polytube, FAD cofactor is shown as grey carbons polytube and ligands as yellow carbons polytube.
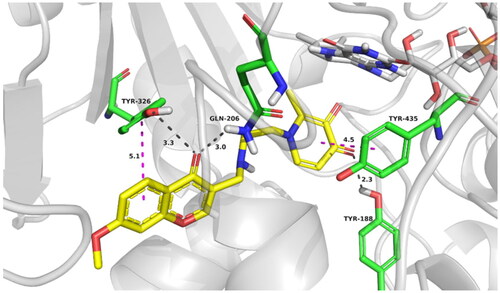
Figure 7. Pargyline (15 mg/kg), Memantine (15 mg/kg), and compound 17d (15 mg/kg) were evaluated for scopolamine-induced (15 mg/kg) memory impairment in ICR mice in the Morris water maze. The mouse trajectories of the mice are shown as the control (D–1), model (D–2), pargyline (D–3), Memantine (D–4), and 17d (D–5) groups. Data are presented as the mean ± SEM (n = 15; #p < 0.05, ##p < 0.01, ###p < 0.001, and ####p < 0.0001, Control group vs. scopolamine model group; *p < 0.05, **p < 0.01, ***p < 0.001, and ****p < 0.0001, Pargyline group, Memantine group, 17d vs. scopolamine model group).
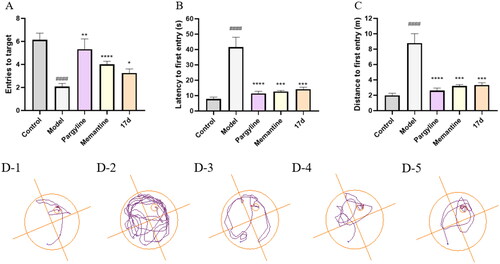
Table 5. Effects of compound 17d (15 mg/kg) on scopolamine-induced memory impairment in ICR mice evaluated by the Morris water maze test.
Figure 8. The pH-dependent UV spectra of compound 17d. (A) The pH-dependence of the titration spectrum of compound 17d. (B) The pKa values of compound 17d over the pH range of 1.3–11.0 in 0.1 M KCl at 25 °C.
Table 6. Pharmacokinetic parameters of 17d after its administrationa.