
Figures & data
Figure 1. Chemical formula of amantadine.
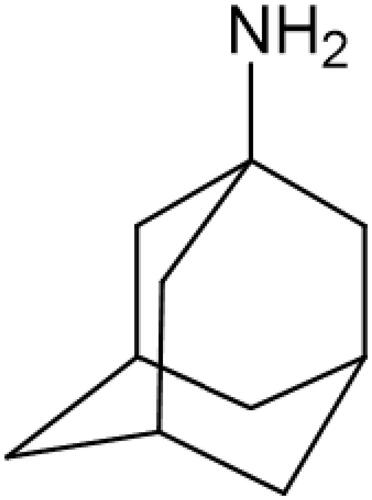
Table 1. Inclusion and exclusion criteria.
Figure 2. Flow diagram of systematic review methodology (Prisma).
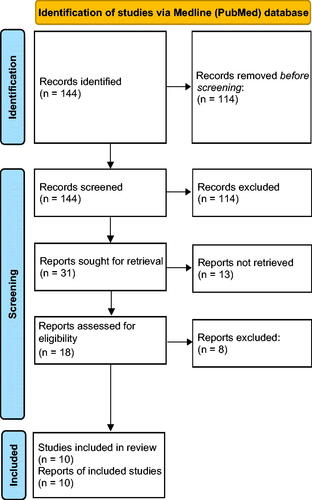
Table 2. Multidirectional properties of amantadine in clinical and experimental studies.
Figure 3. The influence of amantadine and other additives on scavenging of ROS and total antioxidant potential. AA: ascorbic acid; ALA: α-lipoic acid; DPPH: 2,2-diphenyl-1-picrylhydrazyl radical scavenging capacity; H2O2: hydrogen peroxide scavenging; HO•: hydroxyl radical scavenging; NAC: N-acetylcysteine; TAC: total antioxidant capacity; TOS: total oxidant status; ∗p < 0.05 versus control (amantadine); ∗∗p < 0.01 versus control (amantadine); ∗∗∗p < 0.001 versus control (amantadine).
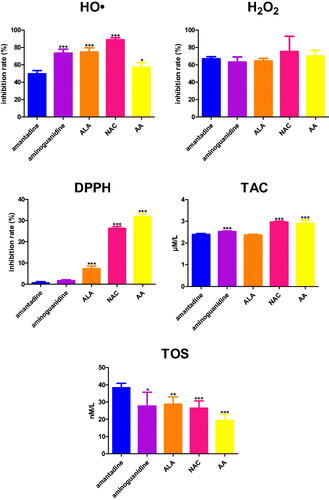
Figure 4. The influence of amantadine and other additives on protein glycoxidation products in various models. AA: ascorbic acid; ALA: α-lipoic acid; BSA: bovine serum albumin; ChT: chloramine T-induced albumin oxidation; DT: dityrosine; Fru: fructose-induced albumin glycation; Gal: galactose-induced albumin glycation; Glc: glucose-induced albumin glycation; GO: glyoxal-induced albumin glycation; KN: kynurenine; MGO: methylglyoxal-induced albumin glycation; NAC: N-acetylcysteine; NFK: N-formylkynurenine; TRY: tryptophan; ∗p < 0.05 versus positive control (glycation/oxidising agent); ∗∗p < 0.01 versus positive control (glycation/oxidising agent); ∗∗∗p < 0.001 versus positive control (glycation/oxidising agent); #p < 0.05 versus negative control (BSA); ##p < 0.01 versus negative control (BSA); ###p < 0.001 versus negative control (BSA).
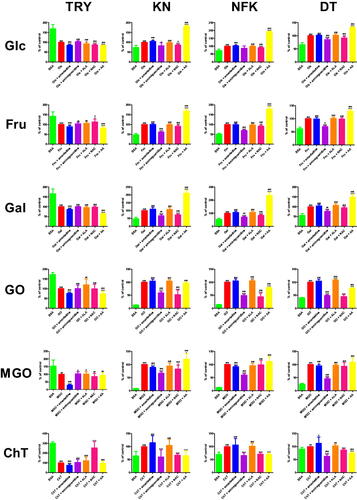
Figure 5. The influence of amantadine and other additives on protein glycation products in various models. AA: ascorbic acid; AGE: advanced glycation end products; ALA: α-lipoic acid; AP: Amadori products; BSA: bovine serum albumin; βA: β-amyloid; ChT: chloramine T-induced albumin oxidation; Fru: fructose-induced albumin glycation; Gal: galactose-induced albumin glycation; Glc: glucose-induced albumin glycation; GO: glyoxal-induced albumin glycation; MGO: methylglyoxal-induced albumin glycation; NAC: N-acetylcysteine; ∗p < 0.05 versus positive control (glycation/oxidising agent); ∗∗p < 0.01 versus positive control (glycation/oxidising agent); ∗∗∗p < 0.001 versus positive control (glycation/oxidising agent); #p < 0.05 versus negative control (BSA); ##p < 0.01 versus negative control (BSA); ###p < 0.001 versus negative control (BSA).
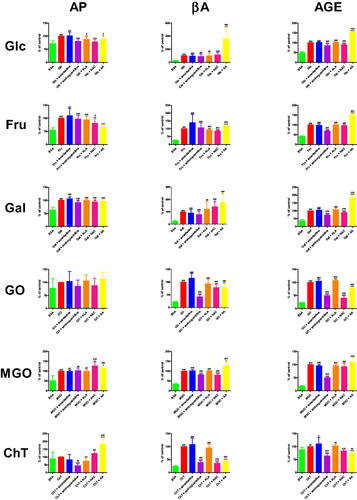
Figure 6. The influence of amantadine and other additives on protein oxidation products in various models. AA: ascorbic acid; ALA: α-lipoic acid; AOPP: advanced oxidation protein products; BSA: bovine serum albumin; ChT: chloramine T-induced albumin oxidation; Fru: fructose-induced albumin glycation; Gal: galactose-induced albumin glycation; Glc: glucose-induced albumin glycation; GO: glyoxal-induced albumin glycation; MGO: methylglyoxal-induced albumin glycation; NAC: N-acetylcysteine; PC: protein carbonyls; ∗p < 0.05 versus positive control (glycation/oxidising agent); ∗∗p < 0.01 versus positive control (glycation/oxidising agent); ∗∗∗p < 0.001 versus positive control (glycation/oxidising agent); #p < 0.05 versus negative control (BSA); ##p < 0.01 versus negative control (BSA); ###p < 0.001 versus negative control (BSA).
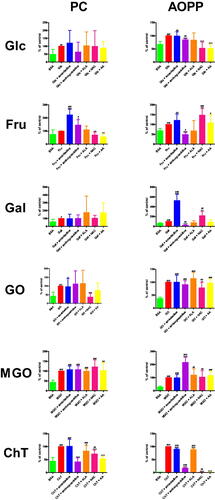
Figure 7. Visualisation of an amantadine docking site (mode 1) in BSA.
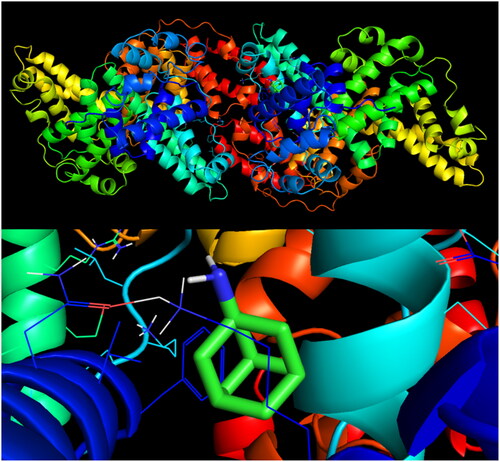
Table 3. The results of a molecular docking simulation of amantadine to BSA.
Supplemental Material
Download PDF (70.7 KB)Data availability statement
The data that support the findings of this study are available from the corresponding author upon reasonable request. Some data may not be made available because of privacy or ethical restrictions.