Figures & data
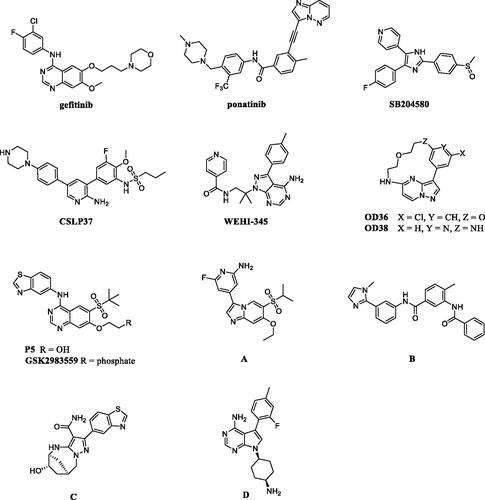
Figure 1. Representative inhibitors of RIPK2.
Scheme 1. Synthesis of 4-aminoquinoline-based derivatives. Reagents and conditions: (a) 6-bromo-4-chloroquinoline, amines, tert-butanol, 80 °C, 4 h; (b) boronic acids or boronic esters, Pd(PPh3)4, Na2CO3, H2O, 1,4-dioxane, 80 °C, 8 h; (c) 2-pyridineboronic acid, Pd(OAc)2, DPPF, Cs2CO3, CuCl, DMF, 80 °C, 12 h; (d) 6-bromo-4-chloroquinoline, amines, NaH, DMF, 0–40 °C.
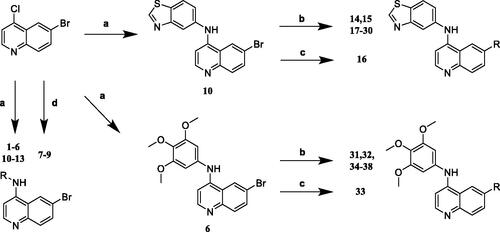
Figure 2. Docking study on compound 14 bound within the ATP site of RIPK2 (PDB ID: 6RNA).
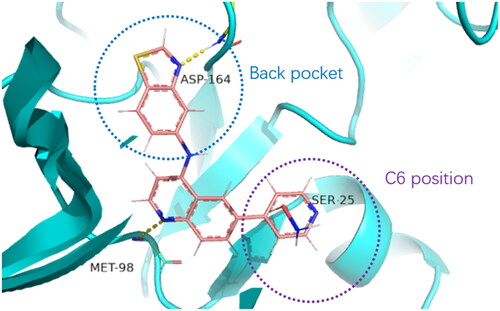
Table 1. Modifications in back pocket of RIPK2.
Table 2. Optimisation on C6 position.
Table 3. Inhibition of compounds 31–38 on RIPK2.
Figure 3. The effect of indicated compounds on the secretion of classic proinflammatory cytokine TNF-α in MDP-induced Raw264.7. TNF-α secretion in the supernatant of Raw264.7 cells from controls without stimulated, controls stimulated and compounds treated under stimulated conditions. The concentrations are presented as the mean ± SD. ###p < 0.001 vs non-stimulated controls group, *p < 0.05, **p < 0.01, ***p < 0.001 vs stimulated controls group, in multivariate analysis.
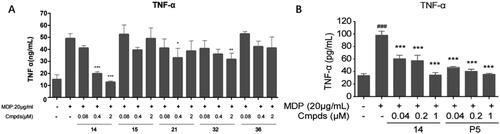
Table 4. Selectivity, ClogP and LipE of compound 14, 15, 21, 32, 36.
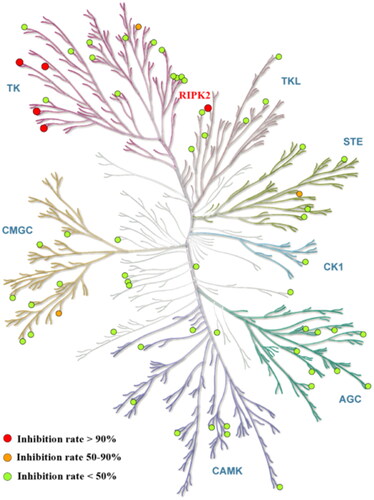
Figure 4. Compound 14 selectivity is represented in a dendrogram view of the human kinome phylogenetic treeCitation25. Red: >90% inhibition (5 kinase). Orange: 50 − 90% inhibition (3 kinases). Green: <50% inhibition. RIP2 kinase (red) inhibited by 97%.