
Figures & data
Figure 1. (A) Reaction mechanism and (B) inhibitors of Ddl.
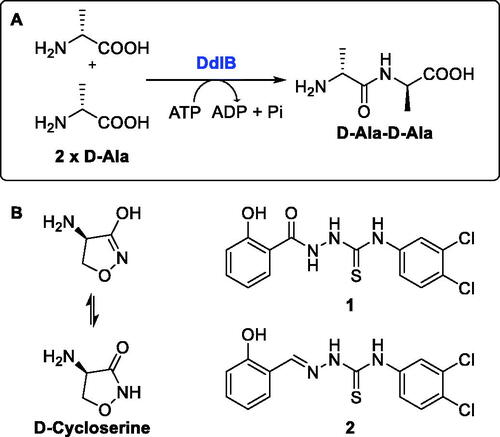
Table 1. Fragment library subsets and number of fragments used for screening on DdlB.
Table 2. Profiling of repurchased fragment hits from the screening.
Figure 2. Fragment hit 3 targeting DdlB. (A) Dose–response inhibition of DdlB for 3. (B) SPR analysis of 3 with the immobilised DdlB. 3 was injected across DdlB in serial dilutions ranging from 78.125 to 5000 µM for 40 s at a flow rate of 30 μL/min, and dissociation was followed for 40 s. Three independent measurements were performed and representative sensorgrams revealing dose-dependent binding of 3 to DdlB are shown. (C) Data were fitted to the steady-state affinity model to obtain the apparent equilibrium dissociation constant (KD). KD values are the mean ± standard deviation of three titrations. (D) ATP (blue sticks) and D-Ala-D-Ala (white sticks) binding sites of DdlB (PDB ID: 4C5C) with the co-crystallised ligands. (E) Computational docking of 3 to the ATP-binding site using extra-precision Glide (blue sticks) and QM-Polarized Ligand Docking (orange sticks) (PDB ID: 4C5C).
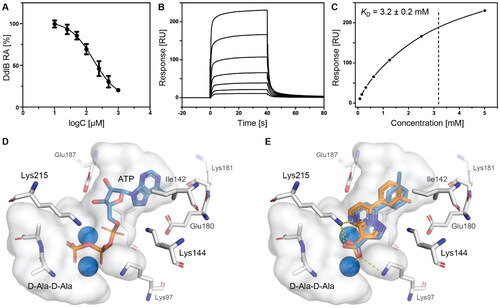
Table 3. Analogues of compound 3 that were evaluated in the DdlB inhibition assay.
Table 4. The breakdown of GlideScore scores into individual contributions, only non-zero terms are shown.