
Figures & data
Figure 1. Examples of enantiomeric pairs of ChE inhibitors of which the mirror images display different potencies.
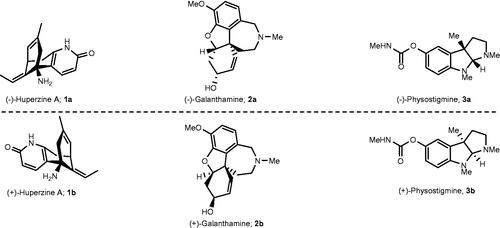
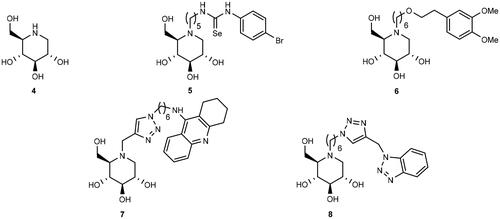
Figure 2. Selected examples of iminosugars that have been investigated as ChE inhibitors.
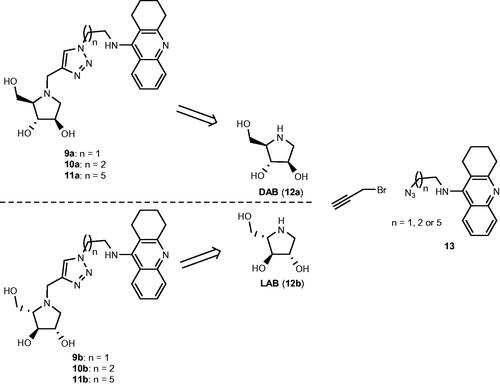
Scheme 1. Retrosynthetic pathways to the optically pure pairs of enantiomers 9a and 9b, 10a and 10b, and 11a and 11b.
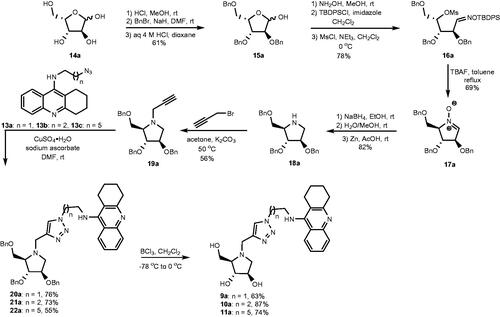
Scheme 2. Synthesis of heterodimers 9a–11a.
Scheme 3. Synthesis of heterodimers 9b, 10b, and 11b.
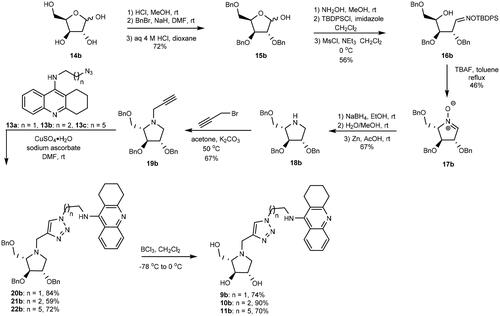
Table 1. IC50 values for the inhibition of eeAcHE and eqBuChE by 9a, 10a, and 11a and with their mirror images 9b, 10b, and 11b.
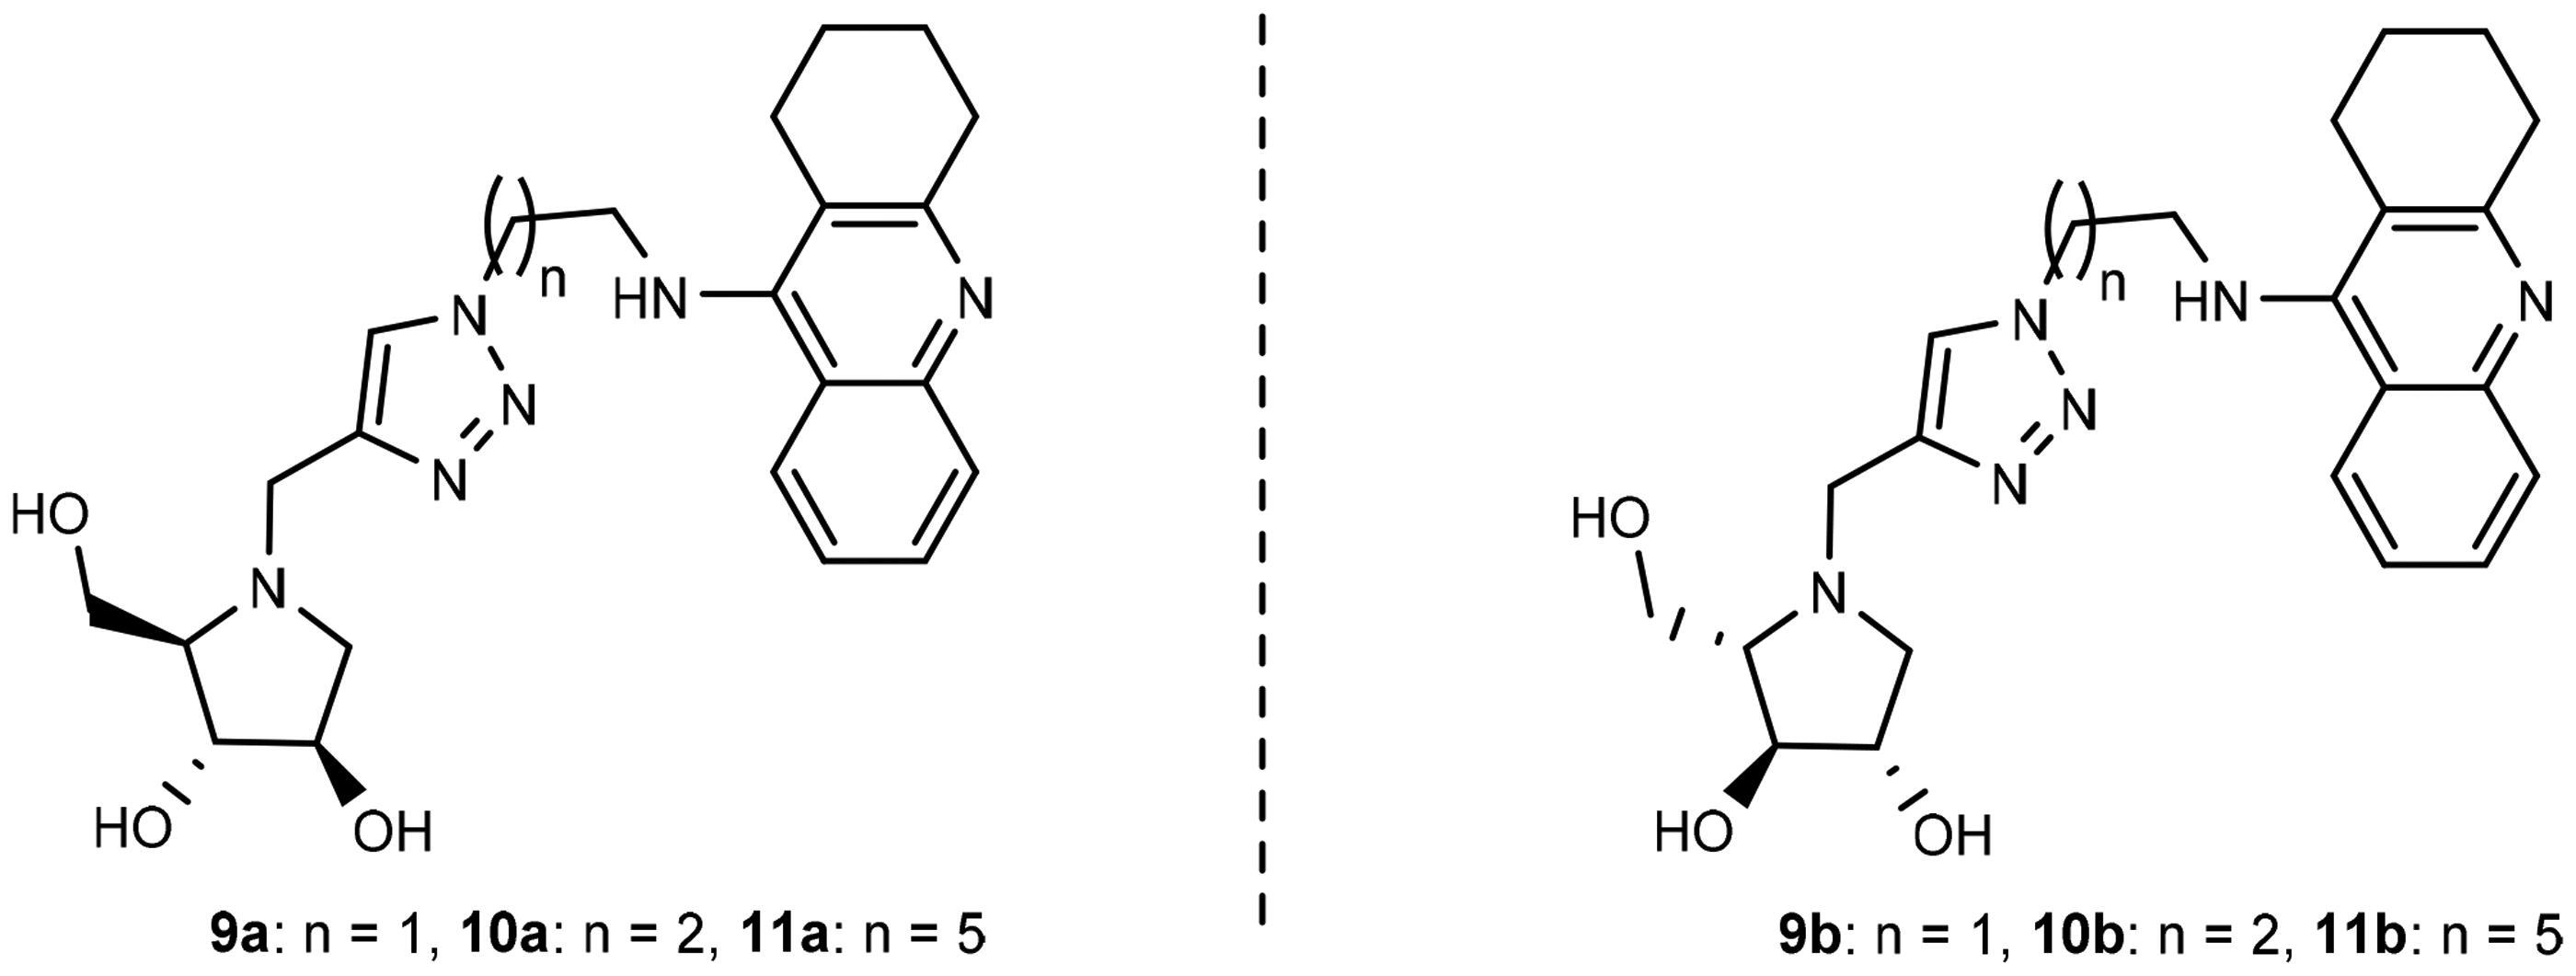
Figure 3. Cornish-Bowden plots for analysing the inhibition mode of eeAChE by 11b.
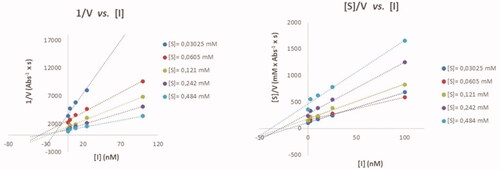
Figure 4. (a) Docking simulations for the interactions in the 11a-rhAChE complex. (b) Three-dimensional structure of rhAChE showing the binding mode of compound 11a. The residues, Ser203, His447, and Glu334 corresponding to the catalytic triad are depicted in sticks.
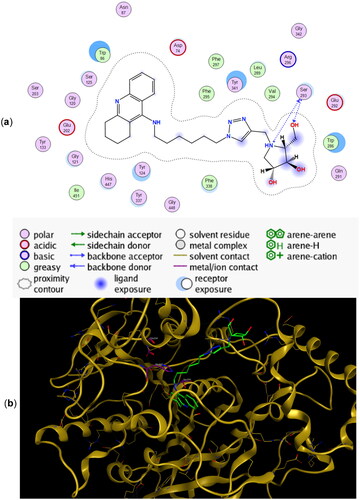
Figure 5. (a) Docking simulations for the interactions in the 11b-rhAChE complex. (b) Three-dimensional structure of rhAChE showing the binding mode of compound 11b. The residues, Ser203, His447, and Glu334 corresponding to the catalytic triad are depicted in sticks.
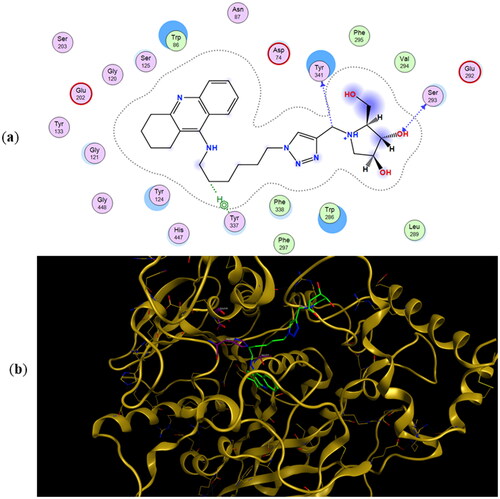
Table 2. Binding energies for 9a, 9b, 10a, 10b, 11a, and 11b to rhAChE and hBuChE.
Figure 6. (a) Docking simulations for the interactions in the 11a-hBuChE complex. (b) Three-dimensional structure of hBuChE showing the binding mode of compound 11a. The residues, Ser198, His438 and Glu325, corresponding to the catalytic triad are depicted in sticks.
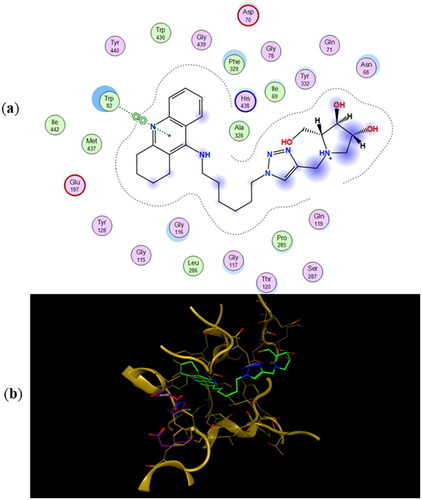
Figure 7. (a) Docking simulations for the interactions in the 11b-hBuChE complex. (b) Three-dimensional structure of hBuChE showing the binding mode of compound 11b. The residues, Ser198, His438, and Glu325, corresponding to the catalytic triad are depicted in sticks.
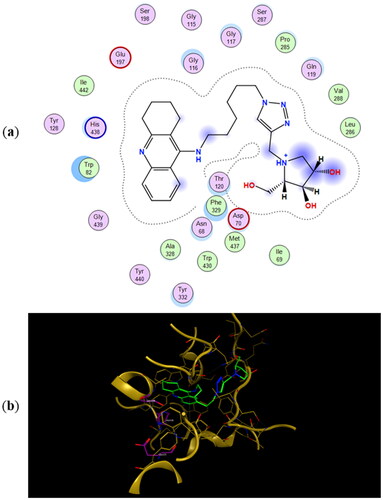
Table 3. Antiproliferative activity (GI50) of 9a, 9b, 10a, 10b, 11a, and 11b against human cancer cells.