Figures & data
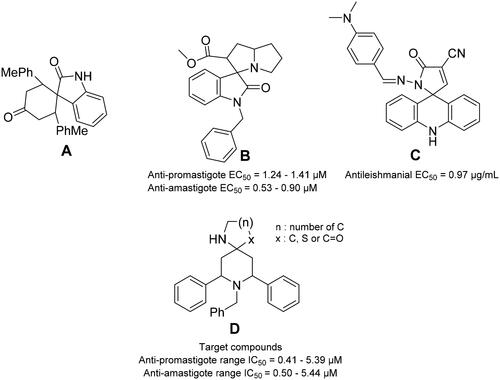
Figure 1. Some reported spiro-compounds with antileishmanial activities A–C, and the target compounds D.
Scheme 1. Synthesis of 1-benzyl-2,6-diarylpiperidin-4-one 1a–d.
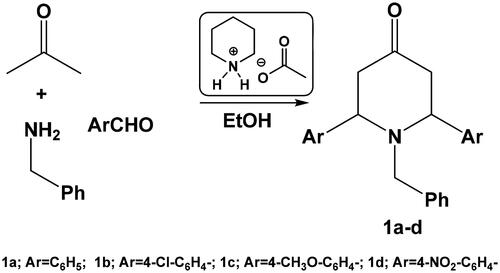
Table 1. Optimisation of reaction conditions of the reaction of acetone, benzaldehyde, and benzylamine.a
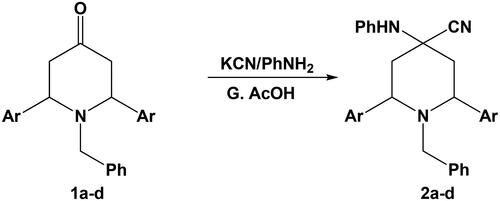
Scheme 2. Synthesis of 1-benzyl-2,6-diaryl-4-(phenylamino)piperidine-4-carbonitrile 2a–d.
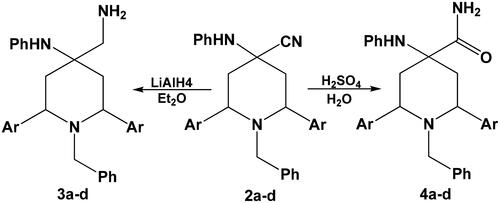
Scheme 3. Reduction and acid hydrolysis of compounds 2a–d.
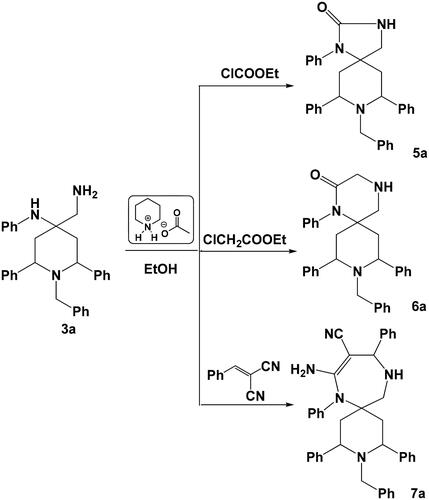
Scheme 4. Synthesis of spiro heterocycles 5a–7a.
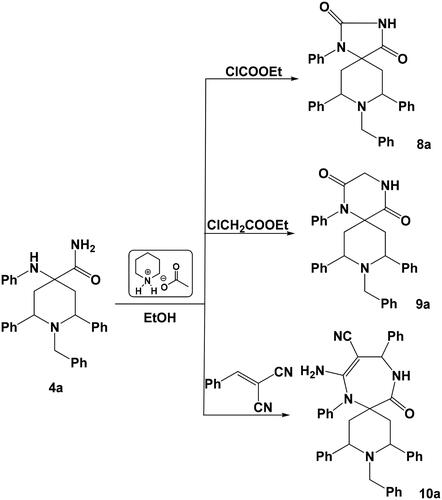
Scheme 5. Synthesis of spiro heterocycles 8a–10a.
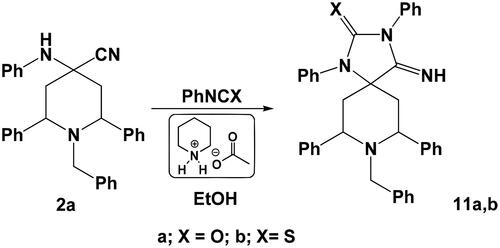
Scheme 6. Synthesis of spiro heterocycles 11a,b.
Scheme 7. Synthesis of spiro heterocycles 12 and 13.
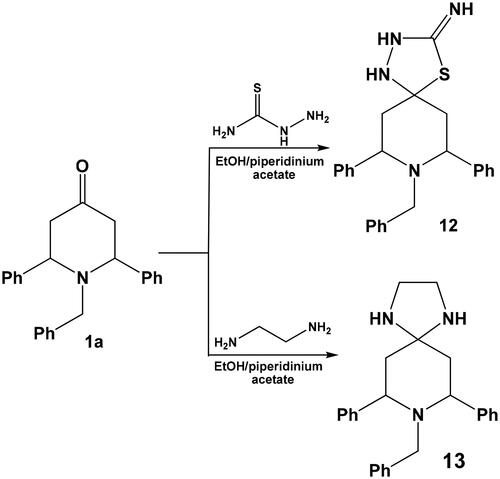
Table 2. Antipromastigote and antiamastigote activity (IC50) of the test compounds and the reference.
Table 3. In vitro evaluation of folate pathway inhibition expressed as percentage survival.a
Table 4. CC50 values of the most active compounds against normal VERO cells and their selectivity index.
Table 5. Docking scores of the most active compounds against PTR1.
Figure 2. The docking poses of 8a and 9a poses as cyan sticks in the binding site of the Lm-PTR1 for (A) and (B), respectively, as 3 D and 2 D depictions. The Simon sticks representation is for NADPH co-factor (annotated as “NDP” in the 2 D depiction). Non-polar hydrogen atoms were omitted for clarity.
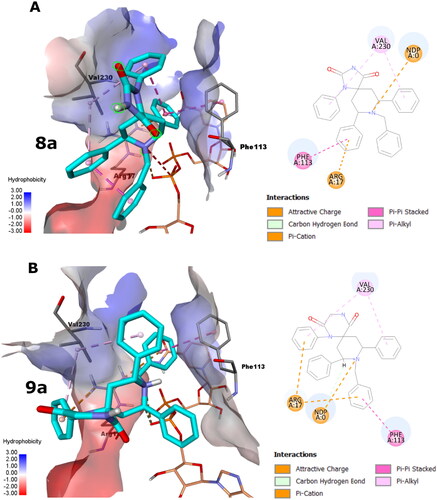
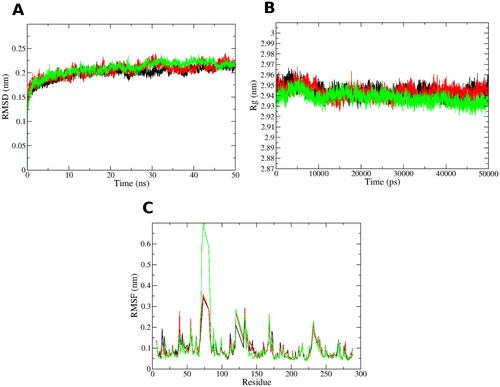
Figure 3. MD simulations for the three systems, the unliganded leishmanial PTR1 (black line), 8a-PTR1 (red line - dark grey) and 9a-PTR1 (green line - pale grey) complex systems. (A) Root mean square deviation (RMSD) of the protein alpha carbon atoms across the 50 ns simulation. (B) Radius of gyration (Rg) for the PTR1 protein across the 50 ns simulation time. (C) Per residue root mean square fluctuation (RMSF).