Figures & data
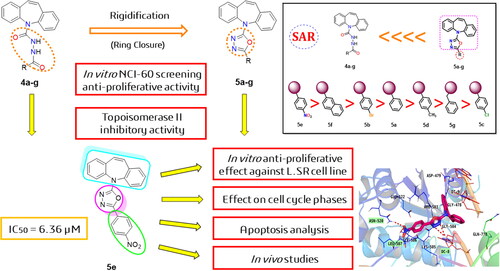
Figure 1. A group of previously reported drugs as topoisomerase II inhibitors and DNA intercalators, bear the same doxorubicin’s pharmacophoric features.
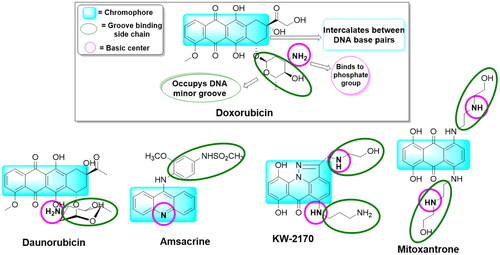
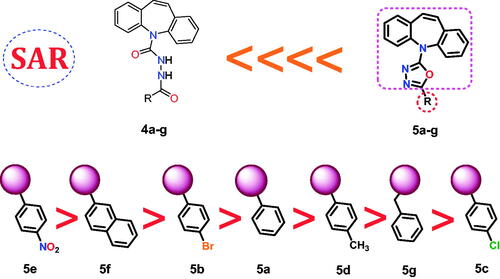
Figure 2. Schematic representation of main pharmacophoric features of the dibenzo[b,f]azepine derivatives (5a–g) as topoisomerase II inhibitors and DNA intercalators (like doxorubicin) produced by the rigidification of candidates (4a–g) using the ring closure principle.
![Figure 2. Schematic representation of main pharmacophoric features of the dibenzo[b,f]azepine derivatives (5a–g) as topoisomerase II inhibitors and DNA intercalators (like doxorubicin) produced by the rigidification of candidates (4a–g) using the ring closure principle.](/cms/asset/64c3e498-7a25-4d71-9bbf-d3401865a03c/ienz_a_2157825_f0002_c.jpg)
Scheme 1. Synthesis of the novel open dibenzo[b,f]azepine analogues (4a–g) and their corresponding target closed ones (5a–g). (i) NaOH/H2O/Reflux, (ii) Phosgene/Toluene/NH2NH2/24 h/RT, (iii) Acid chloride/CHCl3/18 h/RT, and (iv) POCl3/30 min/Reflux.
![Scheme 1. Synthesis of the novel open dibenzo[b,f]azepine analogues (4a–g) and their corresponding target closed ones (5a–g). (i) NaOH/H2O/Reflux, (ii) Phosgene/Toluene/NH2NH2/24 h/RT, (iii) Acid chloride/CHCl3/18 h/RT, and (iv) POCl3/30 min/Reflux.](/cms/asset/fdcfb2bf-30f7-45d2-83c2-c0f20d2b7967/ienz_a_2157825_sch0001_c.jpg)
Table 1. Growth inhibition % of the tested compounds (4a–g and 5a–g) against different 60 cell lines (NCI-60).
Table 2. Topoisomerase II activity of the tested candidates (5a–g) against doxorubicin.
Figure 3. Topoisomerase II inhibitory activity of the tested compounds (5a–g) against doxorubicin. (A) Percentage of topoisomerase II inhibition at concentration (100 µM) of the tested compounds; (B) DNA-fragmentation gel images of the most active compounds (5e and 5f) at various concentrations (100–1.3 µg/ml).
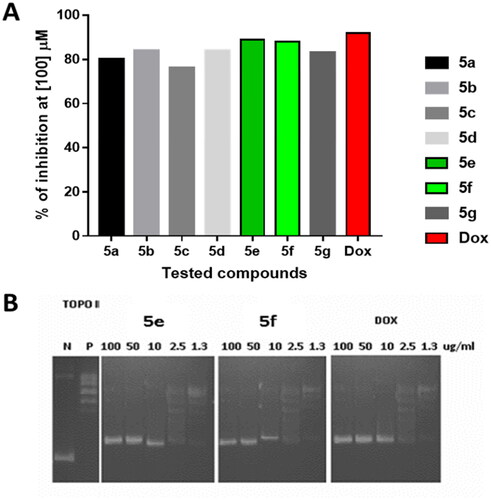
Table 3. The cytotoxicity results of compound 5e against SR and normal cell lines.
Figure 4. Analysis of cell cycle for 5e-treated SR cells. *P < 0.05 compared to control by GraphPad prism using unpaired t-test.
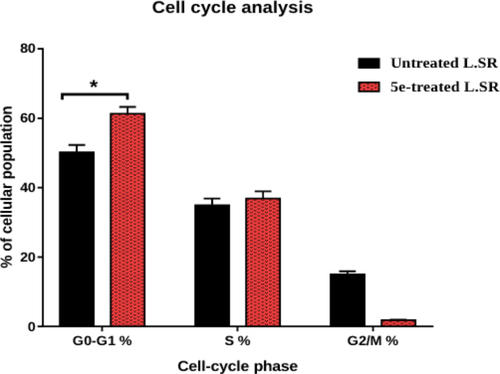
Figure 5. Induction of apoptosis by compound 5e in SR cells shows both apoptotic (late and early) and necrotic cell death. **P < 0.001 and *P < 0.05 compared to control by GraphPad prism using unpaired t-test.
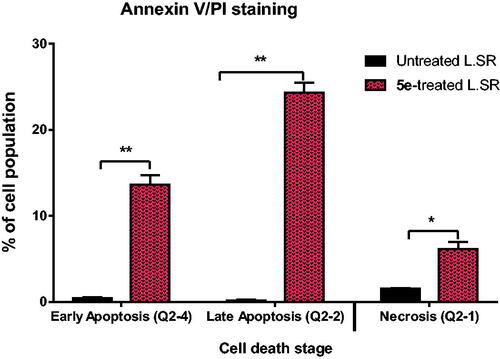
Figure 6. Solid tumour growth was inhibited in SEC-bearing mice by administration of compound 5e (6 mg/Kg B.W., IP) (SEC model). (A) The tumour mass of different treated groups (morphological representation); “normal control, SEC-group, SEC+ 5e, and SEC + Dox.” (B) Anti-tumour activity of tumour mass, volume, and TIR% in different treated groups. (C) Comparative morphological examinations of the tumour tissues tested groups. “Values are expressed as Mean ± SEM values of mice in each group (n = 7).” Values denoted by sign **(P ≤ 0.001) were found to be statistically different from the SEC control when compared with an unpaired t-test in GraphPad Prism. (H&E stain, magnification ×400).
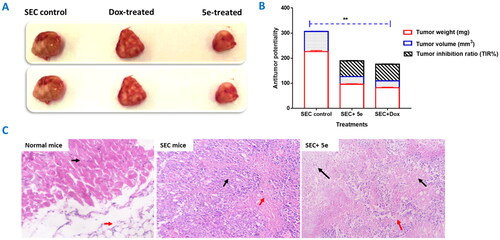
Figure 7. (A): ALT and AST in different SEC-treated groups. “Values are expressed as Mean ± SD of independent trials (n = 7),” “*(P ≤ 0.05) significantly different between SEC control and normal control, while #(P ≤ 0.05) is significantly different between treated groups compared to SEC control.” (B) Histopathological examinations of liver tissues in different treated groups of SEC-bearing mice. (H&E stain, magnification ×400). Normal mice with uniform hepatocytes, and portal tract with uniform portal tract (Black arrows). SEC group show portal tract expansion with chronic inflammatory cells (Black arrows), area of lytic necrosis (Arrowhead), and hydropic degeneration of hepatocytes (Red arrows). Treated 5e group show portal tract inflammation (Black arrow), with spillage of inflammatory cells into the limiting plate (Red arrowhead), foci of lytic necrosis, and mild lobular inflammation (Black arrowheads). Hepatocytes show mild hydropic degeneration (Red arrows).
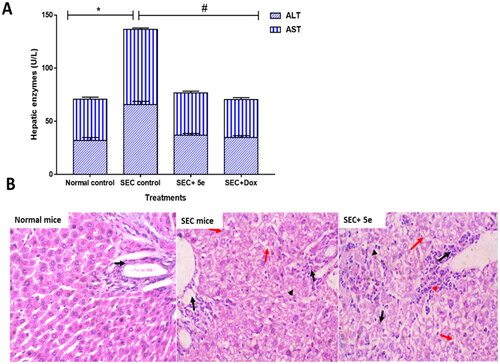
Figure 8. Re-docking of the EVP (green) and its docked pose (yellow).
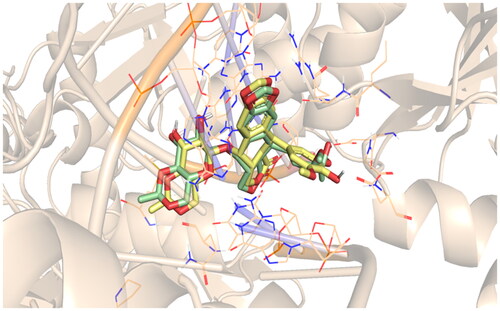
Figure 9. Binding of doxorubicin within the active pocket of topoisomerase II-DNA complex.
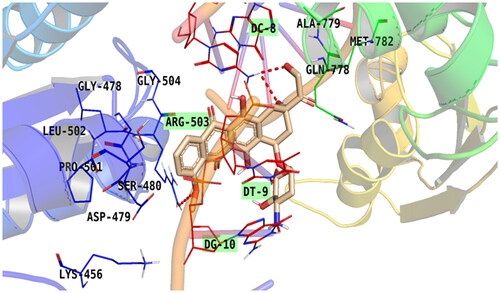
Figure 10. Binding of EVP within the active pocket of topoisomerase II-DNA complex.
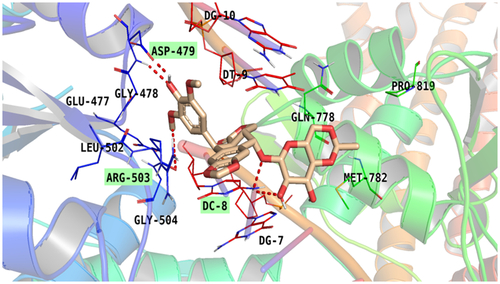
Figure 11. Binding of compound 5e within the active pocket of topoisomerase II-DNA complex.
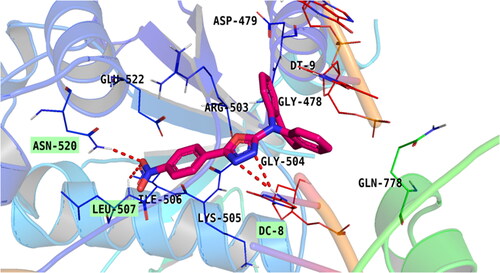
Figure 12. Binding of compounds 5b (A) and 5f (B) inside the topoisomerase II-DNA complex.
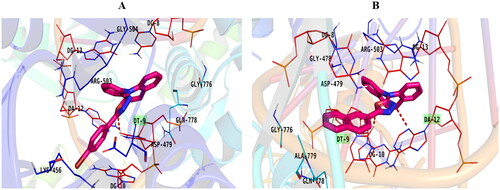
Table 4. Physicochemical parameters of the synthesised compounds 5a–g.
Table 5. Pharmacokinetic and ADMET parameters of the synthesised candidates 5a–g.
Figure 13. SAR for the newly synthesised derivatives 4a–g and 5a–g as topoisomerase II inhibitors and DNA intercalators.