Figures & data
Figure 1. The idea of yeast three-hybrid (Y3H) system [31]. Components: I. Hybrid ligand composed of ligand 1 (L1), linker and ligand 2 (L2) II. First hybrid protein comprised of protein binding L1 and activating domain (AD) of yeast GAL4 transcription factor. III. Second hybrid protein comprised of protein binding L2 and DNA-binding domain (DBD) of yeast GAL4 transcription factor.
![Figure 1. The idea of yeast three-hybrid (Y3H) system [31]. Components: I. Hybrid ligand composed of ligand 1 (L1), linker and ligand 2 (L2) II. First hybrid protein comprised of protein binding L1 and activating domain (AD) of yeast GAL4 transcription factor. III. Second hybrid protein comprised of protein binding L2 and DNA-binding domain (DBD) of yeast GAL4 transcription factor.](/cms/asset/bef36d11-49f6-47b4-b7cc-555e4ab1b36b/ienz_a_2158822_f0001_c.jpg)
Table 1. Substances used to perform calibration curve.
Scheme 1. Synthesis of compounds 2a–2h and 3a–3h. Reagents: (a) 3,5-dichlorobenzoic acid, 2-Chloro-4,6-dimethoxy-1,3,5-triazine (CDMT), N-methylmorpholine, THF; (b) HCl/ether.
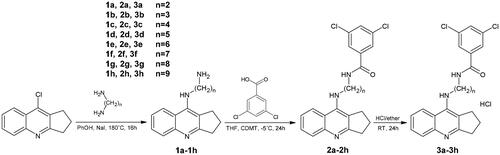
Table 2. The activity of novel compounds 3a–3h against acetylcholinesterase from electric eel and equine butyrylcholinesterase.
Table 3. SH-SY5Y cell viability (%) after treatment with H2O2 (100 µM) or mixture of rotenone (30 µM) and oligomycin A (10 µM) at selected concentrations of 3e.
Figure 2. Acute oral toxicity stages. a – Moribund or dead; b – GHS (Globally Harmonised Classification System mg/kg body weight); c – LD50 cut-off mg/kg body weight.
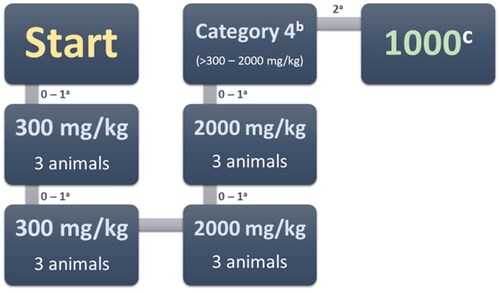
Table 4. LD50 and toxicity class prediction of tacrine, bis-7-tacrine and new hybrids with 3,5-dichlorocarboxylic acid.
Table 5. Inhibition of β-amyloid (Aβ) aggregation by compound 3e at different concentrations. Thioflavin T assay (λexc = 446 nm; λem = 490 nm).
Figure 3. Scatterplots of equation results including a regression line, marked as the continuous line. The dashed lines determine the area of the regression belt at a confidence level of 0.95. (A) Plot pH vs pH-log(Ax-Aa)/(Ab-Ax) 332/343 nm; (B) plot pH vs pH-log(Ax-Aa)/(Ab-Ax) 343/332 nm; (C) plot pH vs pH-log(Ax-Aa)/(Ab-Ax) 332/343 nm; (D) plot pH vs pH-log(Ax-Aa)/(Ab-Ax) 343/332 nm.
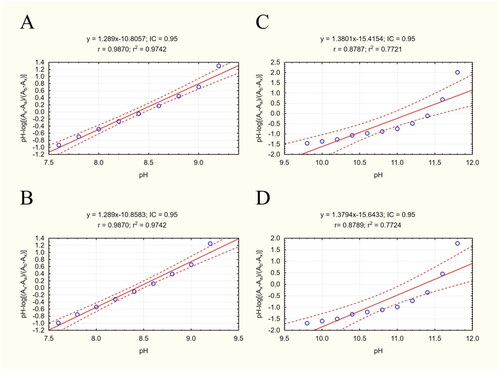
Table 6. Experimental and predicted pKa and logP values of 3e.
Figure 4. Calibration curve for LogP assay. The regression line is marked as a continuous line. Dashed lines determine the area of the regression belt at a confidence level of 0.95.
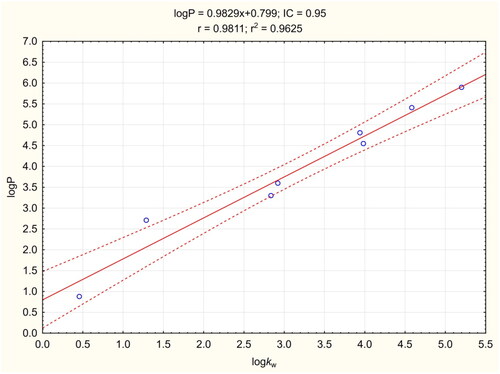
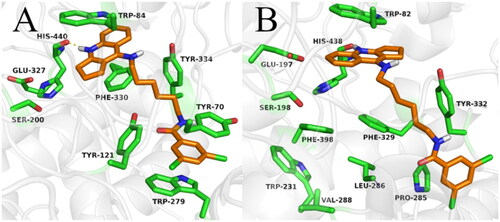
Figure 5. Binding mode of compound 2e within acetylcholinesterase (A) and butyrylcholinesterase (B).