Figures & data
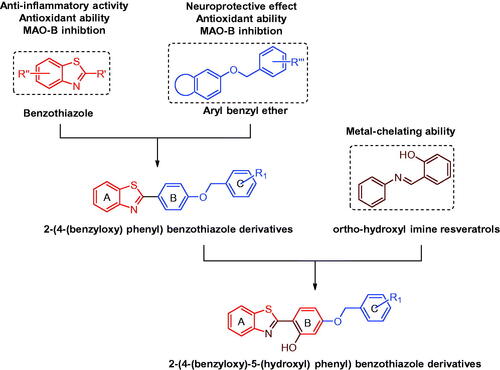
Figure 1. Design strategies of 2-(4-(benzyloxy)-5-(hydroxyl) phenyl) benzothiazole derivatives.
Scheme 1. Synthesis of 2-(4-(benzyloxy)-5-(hydroxyl) phenyl) benzothiazole derivatives (3a–o). Reagents and conditions: (i) 2,4-dihydroxybenzaldehyde, Na2S2O5, DMF; (ii) corresponding substituted benzyl chlorides or benzyl bromides, NaHCO3, KI, CH3CN, at 60 °C for 30 h.
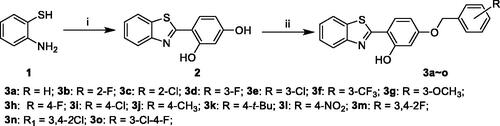
Table 1. Inhibitory effects on MAOs and antioxidative activities of 2-(4-(benzyloxy)-5-(hydroxyl) phenyl) benzothiazole derivatives and reference compounds in vitro.
Figure 2. Kinetic study of MAO-B inhibitory mechanism by compound 3h. (A) Lineweaver-Burk plots of MAO-B activities in the absence and presence of various concentrations of 3h (0.031, 0.062, and 0.124 μM), (B) the slopes of the Lineweaver-Burk plots vs. the 3h concentrations.
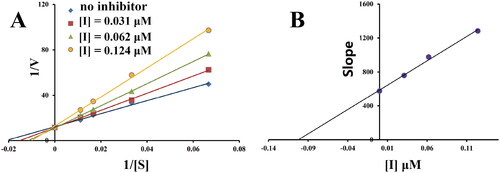
Figure 3. Reversibility of the MAO-B inhibition by 3h, safinamide, and rasagiline.
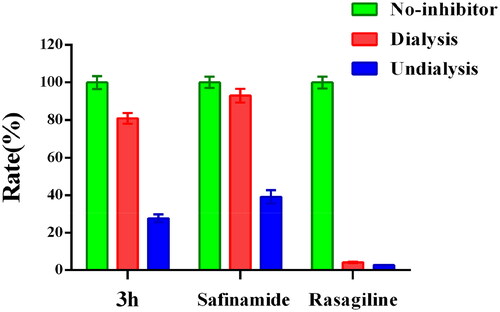
Figure 4. (A) The docking mode of compound 3h with hMAO-A (PDB ID: 2Z5X), (B) The docking mode of compound 3h with hMAO-B (PDB ID: 2V5Z), 3h and amino acid residues that participate in the interactions were displayed as sticks and coloured by the element, hydrogen bonds are showed as green dashed lines.
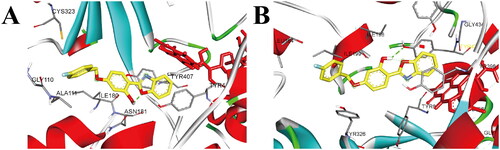
Figure 5. (A) UV spectra of compound 3h (75.0 μM in methanol) with or without FeSO4, ZnCl2, CuCl2, FeCl3, or AlCl3 (75.0 μM in methanol); (B) UV spectra of compound 3h (75.0 μM in methanol) with FeSO4 (0, 7.5, 15.0, 30.0, 45.0, 60.0, 75.0, 112.5, 150.0, and 187.5 μM); (C) Determination of the stoichiometry of 3h-Fe2+ complex by using the molar ratio method of titrating the methanol solution of compounds 3h with ascending amounts of FeSO4.
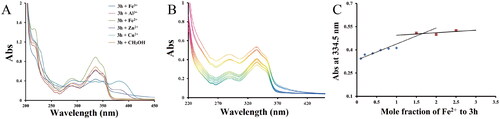
Table 2. Permeability results Pe (×10−6 cm/s) for 3h and its predicted penetration into CNS.
Figure 6. (A) Cytotoxicity of 3h towards PC-12 cells. (B) Neuroprotective effects of 3h and resveratrol. Three independent experiments were performed in triplicate. Data were expressed as mean ± SD. ##p < 0.01 vs. control; **p < 0.01 vs. model group.
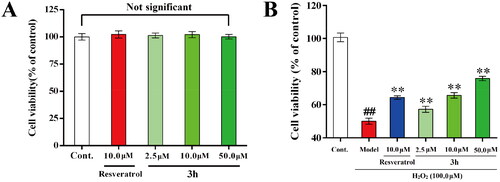
Figure 7. The effects of resveratrol and 3h on the cell viability of BV-2 cells (A) without LPS and (B) in the presence of LPS (1.0 μg/mL). Each assay was carried out at least three times and data are expressed as mean ± SD.
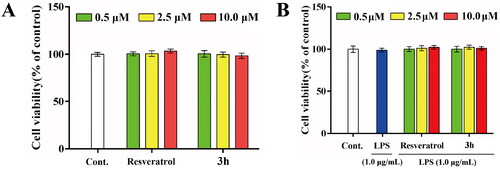
Figure 8. The inhibitory effects of resveratrol and 3h on NO release (A) and TNF-α production (B) in LPS-activated BV-2 microglia cells. The data are expressed as the mean ± SD from three independent experiments. #p < 0.05 vs. control group; *p < 0.05 vs. model group.
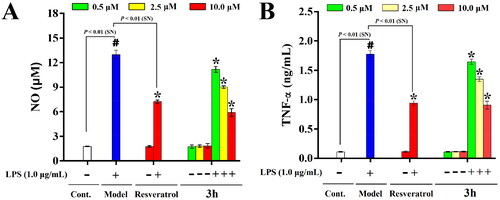
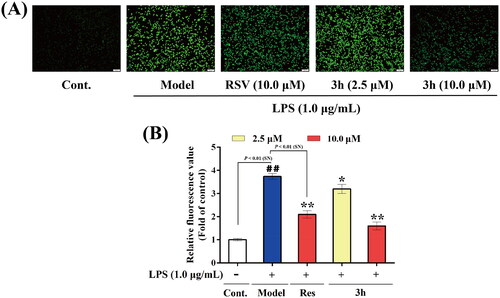
Figure 9. The inhibitory effects of resveratrol and 3h on LPS-induced ROS release in BV-2 microglia cells. (A) representative images, (B) relative fluorescence values obtained by microplate reader. The data are expressed as the mean ± SD from three independent experiments. ##p < 0.01 vs. control; *p < 0.05 vs. model group; **p < 0.01 vs. model group.