
Figures & data
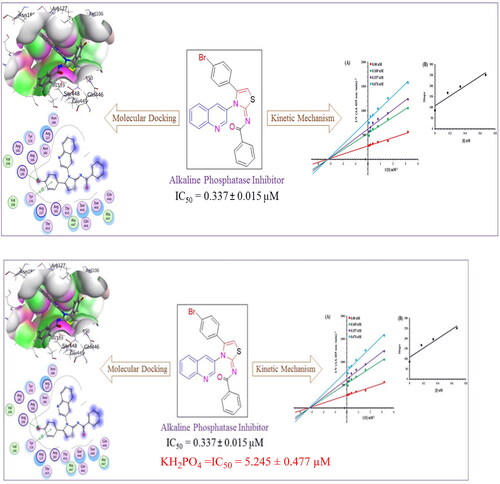
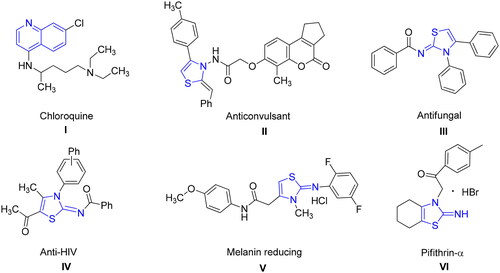
Figure 1. Structures of biologically active quinoline and thiazolines.
Scheme 1. Synthetic route for synthesis of quinolinyl iminothiazoline 6(a–j).

Table 1. Geometrical Parameters of selected compounds.
Figure 2. Optimised structures of potent compounds (6d, 6e, 6g and 6i).
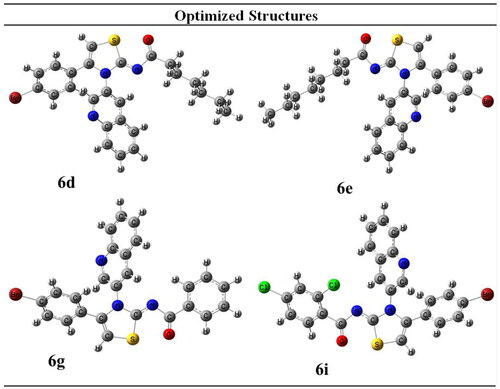
Figure 3. HOMO-LUMO structures of potent compounds (6d, 6e, 6g and 6i).
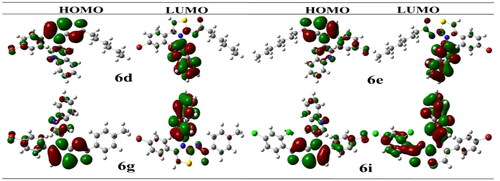
Table 2. Energetic parameters that predict reactivity of compounds.
Table 3. IC50 values of compounds 6(a–j) values of alkaline phosphatase inhibitory activity.
Figure 4. Alkaline phosphatase inhibition by compounds 6g as shown by Lineweaver-Burk plots (a). The plot of the slope vs inhibitor concentrations to get the inhibition constant is shown in the insets (b). Using the linear least squares fit, the lines were drawn.
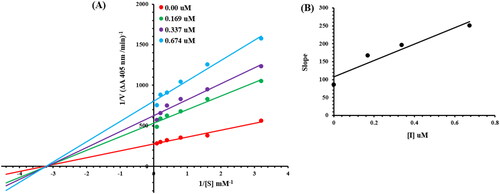
Table 4. Kinetic parameters of the alkaline phosphatase for para nitrophenyl phosphate disodium salt activity in the presence of different concentrations of 6g.
Table 5. Binding energies of the potent inhibitors of alkaline phosphatase.
Figure 5. Illustrating the 3D and 2D binding interactions of potent compounds (6d, 6e, 6g, 6i and 6j).
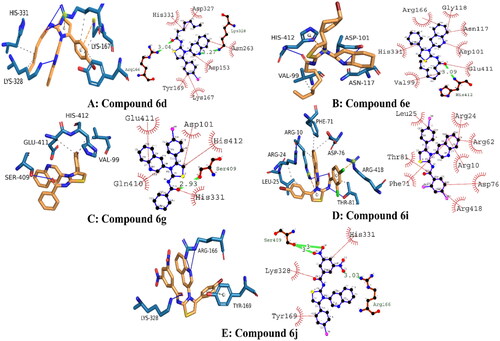
Figure 6. RMSD trajectory analysis for protein (brown coloured trajectory), protein ligand complex (blue coloured trajectory).
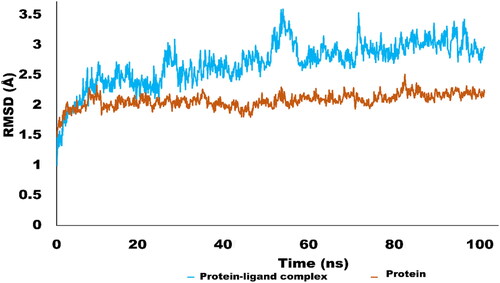
Figure 7. Evolution of RMSF for amino acid residues of targeted protein.
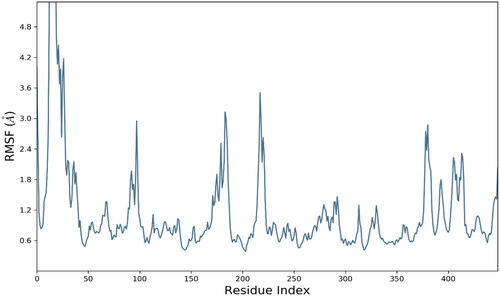
Figure 8. Contact profile for protein-ligand complex. Green coloured peaks are representing hydrogen bonding while purple peaks are representing hydrophobic interactions. Blue coloured histograms are water bridges.
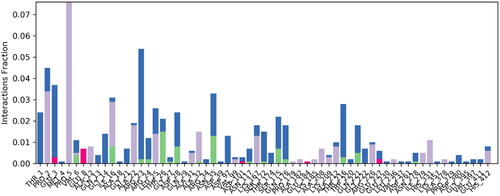
Figure 9. Ligand properties analysed using various analytical metrics.
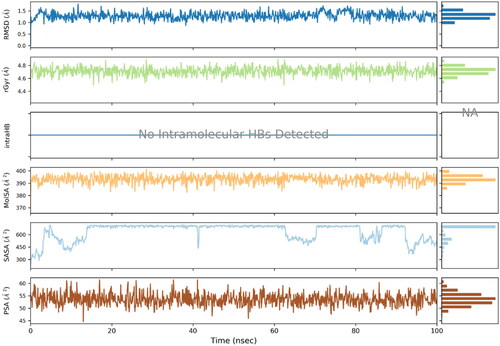
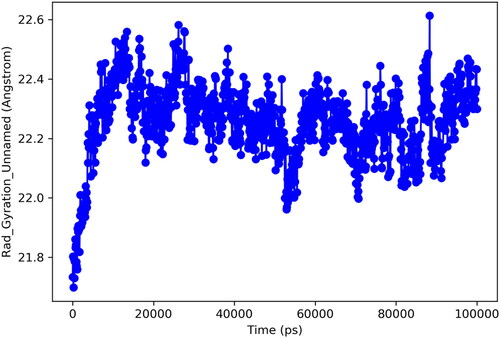
Figure 10. Radius of gyration.
Supplemental Material
Download PDF (623.3 KB)Data availability statement
All research data will be made available on request.