
Figures & data
Scheme 1. The design of target compounds.
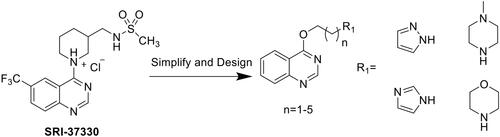
Table 1. Primer sequences for real-time PCR assays.
Scheme 2. The synthetic route of quinazoline containing nitrogenous heterocyclic derivatives.
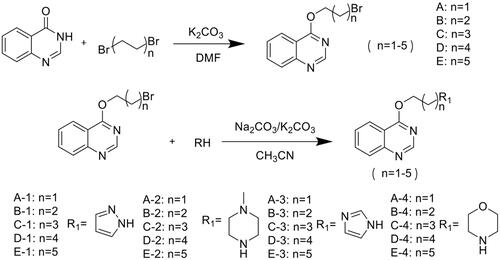
Table 2. The structure of 20 quinazoline derivatives.
Figure 1. The anti-apoptosis activity with different concentrations of compounds D-2 and C-1. Min6 β cells were incubated with different concentrations of D-2 and C-1 and then exposed to PA (300 μmol/L) for 24 h. **p < 0.01 vs control cells; #p < 0.05, ##p < 0.01 vs PA-treated cells. Data were presented as mean ± SD (n = 5).
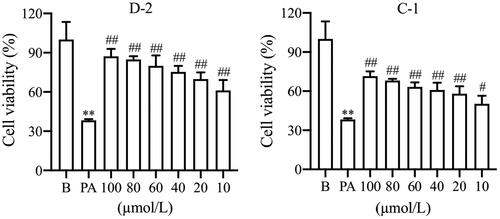
Table 3. The anti-apoptosis activity of quinazoline derivatives at a concentration of 100 μmol/L.
Figure 2. Compounds D-2 and C-1 inhibited TXNIP expression via promoting protein degradation. (A) Min6 β cells were incubated with D-2 and C-1 at concentration of 10 μmol/L for 24 h. (B) Min6 β cells were incubated with cycloheximide (50 μmol/L) and D-2 (10 μmol/L) with or without addition of MG-132 (10 μmol/L) for 24 h. (C) Min6 islet β cells were incubated with cycloheximide (50 μmol/L) and C-1 (10 μmol/L) with or without addition of MG-132 (10 μmol/L) for 24 h. Protein expression of TXNIP was measured by Western blot. **p < 0.01 vs control cells; ##p < 0.01 vs indicated cells. Data were presented as mean ± SD (n = 4).
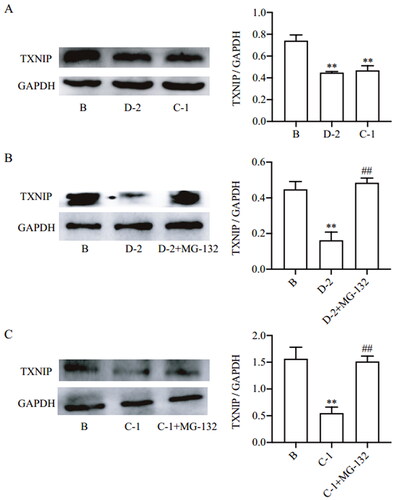
Figure 3. Compounds D-2 and C-1 reduced ROS generation in PA-induced Min6 cells. Min6 β cell were incubated with D-2 and C-1 at concentration of 10 μmol/L and then exposed to PA (300 μmol/L) for 8 h. Immunofluorescence staining for ROS was photographed by fluorescence microscopy. Bar: 100 μm.
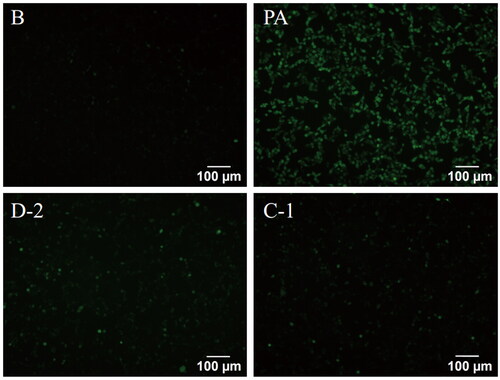
Figure 4. Compounds D-2 and C-1 protected Min6 cells from PA-induced inflammatory injury via TXNIP-NLRP3 signalling. Min6 β cell were incubated with D-2 and C-1 at concentration of 10 μmol/L and then exposed to PA (300 μmol/L) for 12 h. Protein expressions of TXNIP, NLRP3 and cleaved caspase 1 were measured by Western blot. *p < 0.05 & **p < 0.01 vs control cells; #p < 0.05 & ##p < 0.01 vs PA-treated cells. Data were presented as mean ± SD (n = 4).
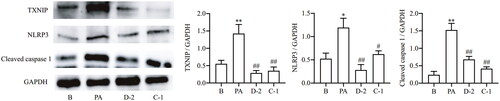
Figure 5. Compounds D-2 and C-1 inhibited gene expression of inflammatory cytokines. Min6 β cell were incubated with D-2 and C-1 at concentration of 10 μmol/L and then treated with PA (300 μmol/L) for 24 h. Gene expressions of IL-1β and IL-6 were detected using the RT-PCR method. **p < 0.01 vs control cells; #p < 0.05 & ##p < 0.01 vs PA-treated cells. Data were presented as mean ± SD (n = 5).
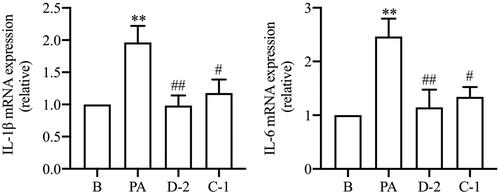
Figure 6. Compounds D-2 and C-1 inhibited caspase 3 activation. Min6 β cells were incubated with D-2 and C-1 at concentration of 10 μmol/L and then exposed to PA (300 μmol/L) for 12 h. Protein expression of cleaved caspase 3 was measured by Western blot. **p < 0.01 vs control cells; ##p < 0.01 vs PA-treated cells. Data were presented as mean ± SD (n = 4).
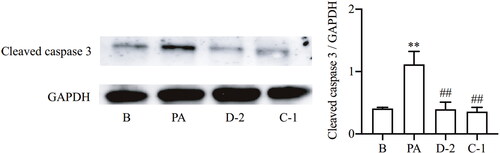
Figure 7. Bioavailability radar plot of compounds D-2 and C-1.
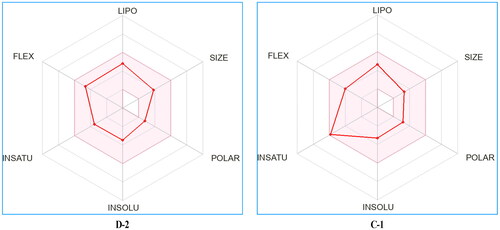
Table 4. Physicochemical and pharmacokinetic parameters of compounds D-2 and C-1 predicted with SwissADME online tool.