
Figures & data
Figure 1. The structure of quinoline, clioquinol and PBT2.
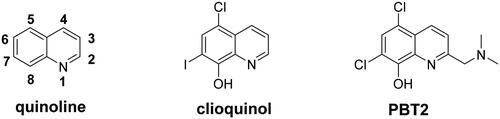
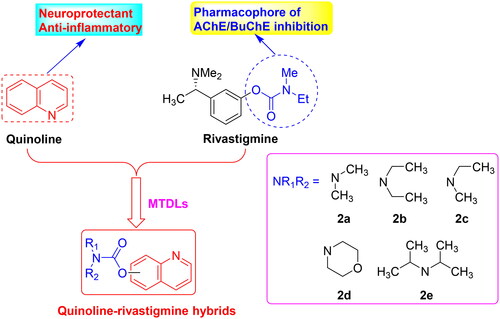
Figure 2. The design strategy of quinoline-rivastigmine hybrids.
Scheme 1. Synthesis of target compounds 3a-3q. Reagents and conditions: (i) 1.3 equivalent N,N-disubstituted carbamoyl chlorides (2a-2e), 1.5 equivalent K2CO3, CH3CN, 65 °C, for 6–10 h.
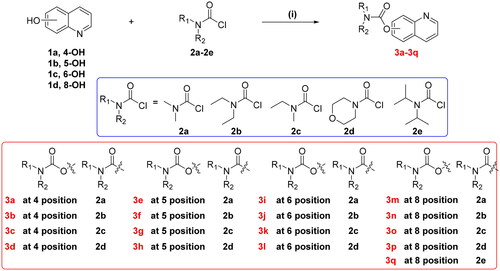
Table 1. AChE/BuChE inhibitory activities by target compounds 3a–3q, rivastigmine, and donepezil.
Figure 3. The cell viability of compounds 3a, 3c, 3e, 3f, 3k, 3m, and 3n on the BV-2 cells, which was determined using MTT assay. The data are expressed as the mean ± SD by three independent experiments.
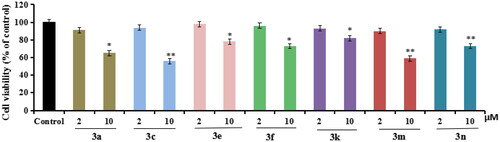
Figure 4. Effects of compounds 3a, 3c, 3e, 3f, 3k, 3m, and 3n on the production of IL-6, IL-1β and NO in LPS-stimulated BV-2 cells. (A) Effects of compounds 3a, 3c, 3e, 3f, 3k, 3m, and 3n on the production of IL-6; (B) Effects of compounds 3a, 3c, 3e, 3f, 3k, 3m, and 3n on the production of IL-1β; (C) Effects of compounds 3a, 3c, 3e, 3f, 3k, 3m, and 3n on NO release. Data were expressed as mean ± SD through three independent experiments. ##p < 0.01 vs control; **p < 0.01, *p < 0.05 vs LPS-induced model group.
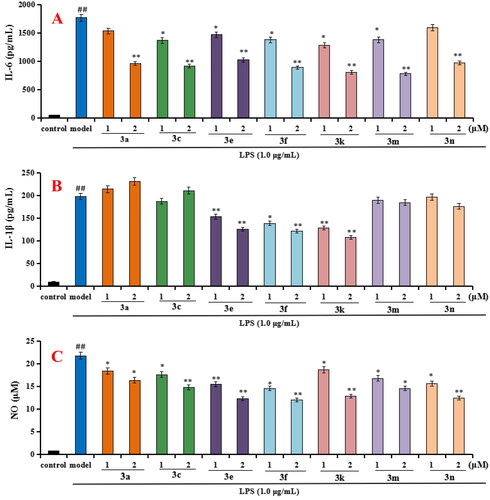
Figure 5. (A) hAChE recovery after preincubation of compound 3f diluted to 1× or 0.1 × IC50, compared to donepezil (done.) diluted, rivastigmine (riva.) diluted and undiluted inhibition. (B) hAChE recovery of donepezil, 3f diluted to 0.1 × IC50, were monitored with time at room temperature for 120 min. Data were expressed as the mean ± SD by three independent experiments.
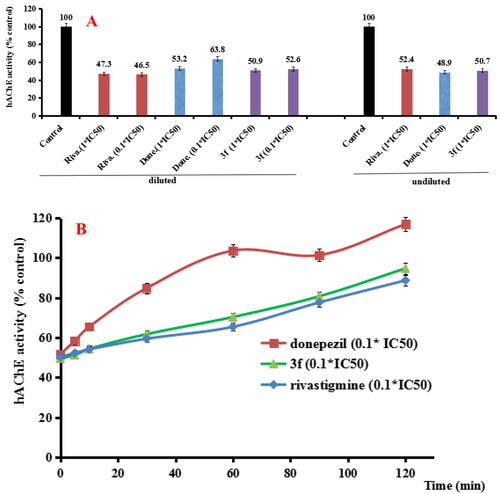
Figure 6. (A) hBuChE recovery after preincubation of compound 3f diluted to 1× or 0.1 × IC50, compared to donepezil (done.) and rivastigmine (riva.) diluted, and undiluted inhibition. (B) hBuChE recovery of donepezil, rivastigmine and 3f diluted to 0.1 × IC50, were monitored with time at room temperature for 240 min. Data were expressed as the mean ± SD by three independent experiments.
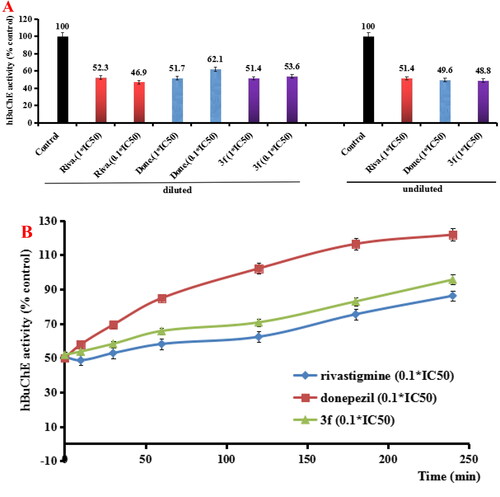
Figure 7. Enzyme kinetic study on the mechanism of eeAChE inhibition by compound 3f. (A) Overlaid Lineweaver-Burk reciprocal plots of AChE initial velocity at increasing acetylthiocholine concentration in the absence and in the presence of 3f were determined. (B) The plots of slope versus the concentration of 3f for determining the inhibition constants Ki.
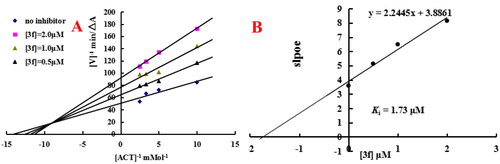
Figure 8. (A) Compound 3f (green stick) acted on residues in the binding site of hAChE (PDB code: 4ey4). (B) D docking model of 3f with hAChE.
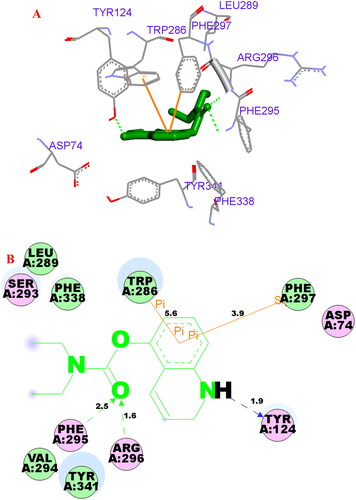
Figure 9. (A) Compound 3f (green stick) acted on residues in the binding site of hBuChE (PDB code: 4tpk). (B) 2 D docking model of 3f with hBuChE.
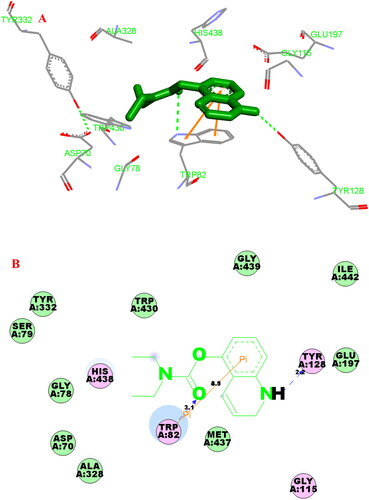
Figure 10. (A) RMSD analysis of compound 3f with hAChE (PDB code: 4ey4) (black stick); (B) RMSD analysis of compound 3f with hBuChE (PDB code: 4tpk) (black stick).
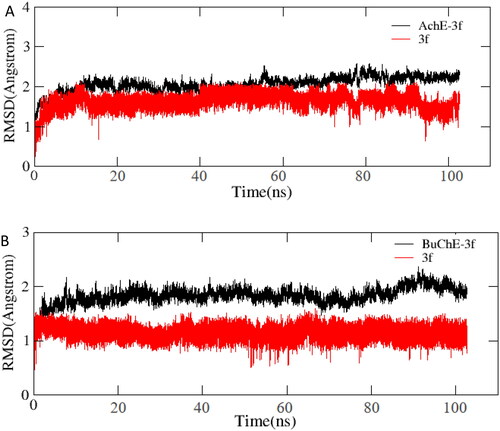
Figure 11. (A) The docking model for 3f into protein crystal structure of hAChE (PDB code: 4ey4). (B) The docking model for 3f into protein crystal structure of hBuChE (PDB code: 4tpk).
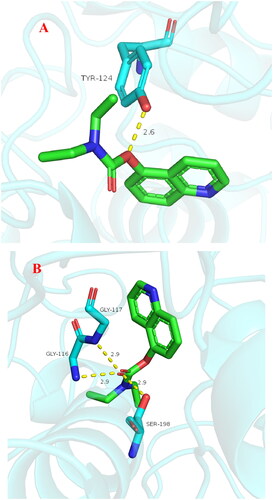
Table 2. The binding free energy and components of 3f-AChE and 3f-BuChE (kcal/mol).
Figure 12. Cell viability was tested by MTT assay. (A) Cytotoxicity of compounds 3a, 3c, 3e, 3f, 3k, 3m, and 3n on PC12 cells. (B) Attenuation of Aβ25-35-induced PC12 cell injury by compounds 3a, 3c, 3e, 3f, 3k, 3m, and 3n. values were expressed as mean ± SD by three independent experiments. ##p < 0.01 vs control; **p < 0.01, *p < 0.05 vs Aβ25-35 group.
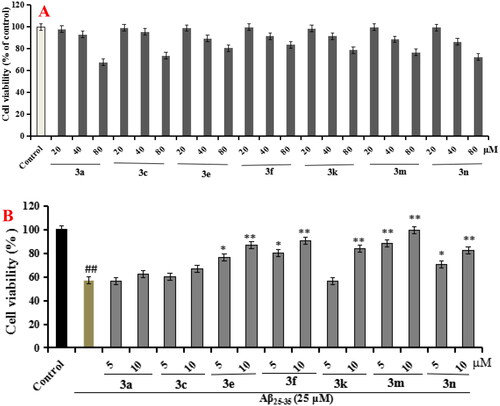
Figure 13. Stability of compound 3f in artificial gastrointestinal fluids (n = 3).
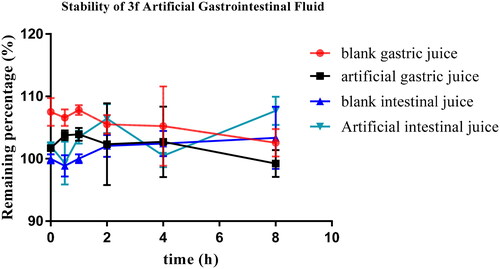
Figure 14. (A) rat liver microsomes stabilities of compound 3f (n = 3); (B) the plasma stability of compound 3f (n = 3).
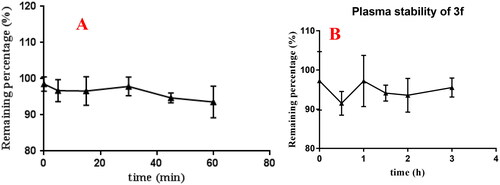
Figure 15. The acute toxicity of compound 10c. (A) The percentage survival (%); (B) morphologic change; (C) changes of pericardial edema/body length; (D) changes of swim bladder area; (E) changes in the liver; (F) changes of liver fluorescence area; (G) changes of median fluorescence intensity.
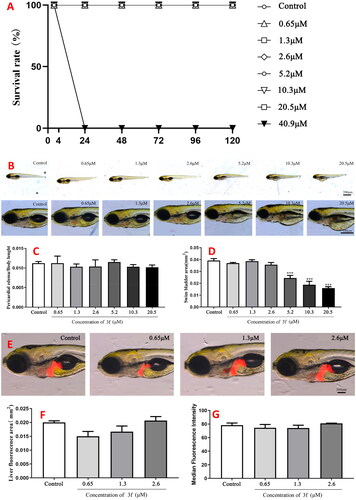
Figure 16. The total velocity of compound 3f on AlCl3-induced zebrafish AD model (n = 60). And the white and dark stripes on x-axis represent periods of light and dark, respectively.
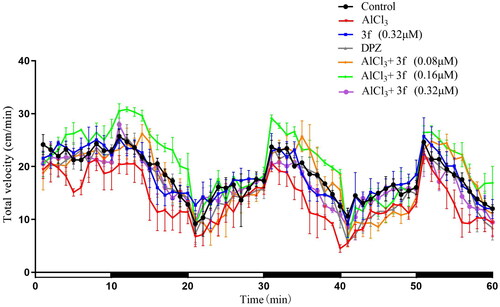
Figure 17. The total distance moved of compound 3f on AlCl3-induced zebrafish AD model. (A) Under the dark environment; (B) Under the light environment; (C) Under alternating dark light stimuli condition. #p < 0.05 and ###p < 0.001 vs untreated group. *p < 0.05, **p < 0.01 and **p < 0.001 vs model group.
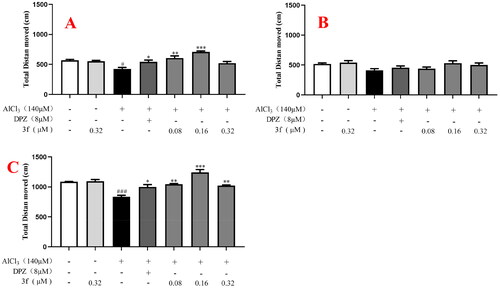
Figure 18. The total velocity of compound 3f on AlCl3-induced zebrafish AD model. (A) Under the dark environment; (B) under the light environment; (C) under alternating dark light stimuli condition. #p < 0.05 and ###p < 0.001 vs untreated group. *p < 0.05, **p < 0.01 and **p < 0.001 vs model group.
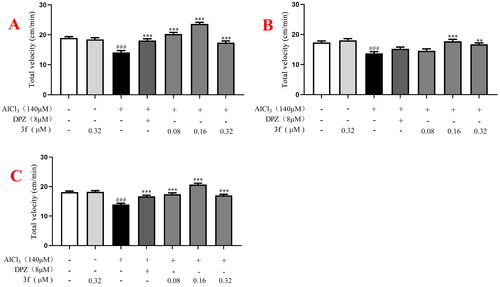
Figure 19. (A) The AChE activity of 3f on AlCl3-induced zebrafish AD model. (B) The ACh level of 3f on AlCl3-induced zebrafish AD model. ##p < 0.01 and ###p < 0.001 vs untreated group. **p < 0.01 and **p < 0.001 vs model group.
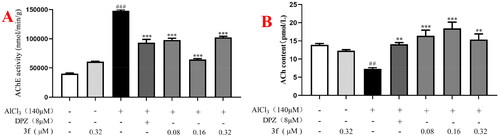
Table 3. Mass spectrometry parameters for 3f.