
Figures & data
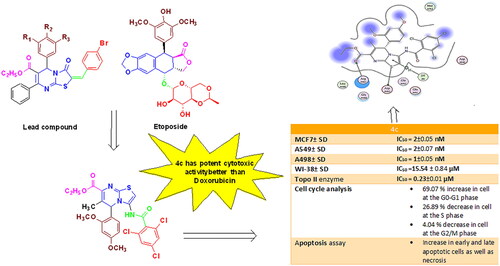
Figure 1. Basic features of some reported Topo II inhibitors.
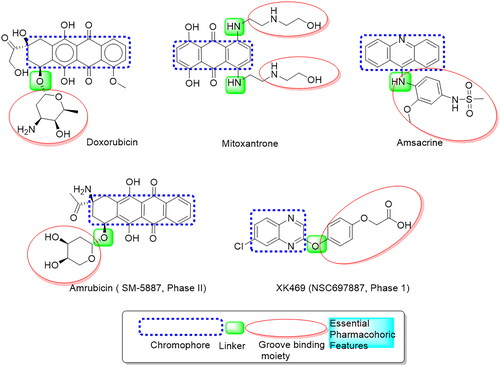
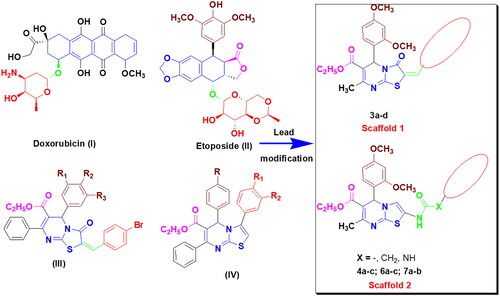
Figure 2. Rationale for designing new Topo II inhibitors.
Scheme 1. The synthetic pathway for the preparation of the starting material 1 and thiazolo[3,2-a]pyrimidines 2 and 3a–d
![Scheme 1. The synthetic pathway for the preparation of the starting material 1 and thiazolo[3,2-a]pyrimidines 2 and 3a–d](/cms/asset/e66c91fd-ba84-4a19-b154-c4ad6c1d2b51/ienz_a_2175209_sch0001_b.jpg)
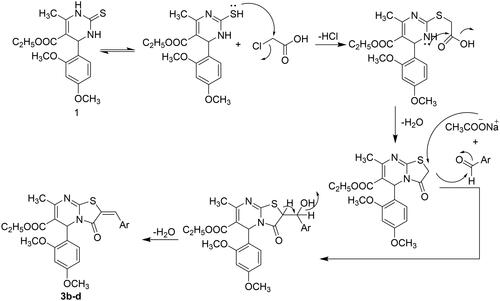
Figure 3. Plausible mechanism for synthesis of compounds 3b–d.
Scheme 2. The synthetic approach for the three sets of amide derivatives 4a–c, 5, 6a–c and 7a,b.
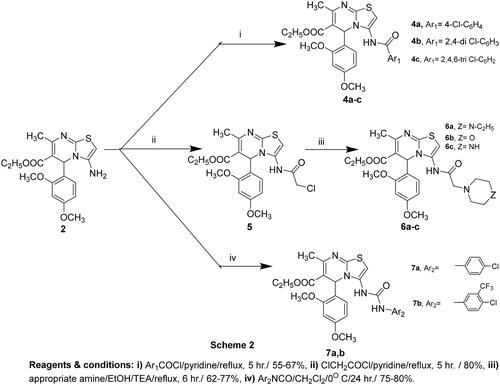
Table 1. IC50 values of the designed targets against MCF7, A549, and A498 cell lines.
Figure 4. SAR study for the designed thiazolopyrimidines.
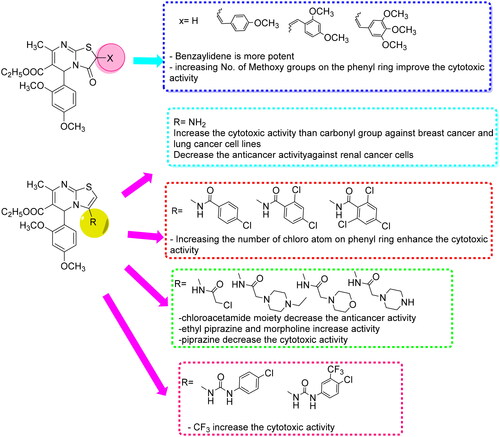
Figure 5. Agarose gel electrophoresis of compounds 3b-3d, 4c, 6a, 6b, 7a and 7b with Etoposide and Doxorubicin at 100, 10, 1, 0.1 μM concentrations.
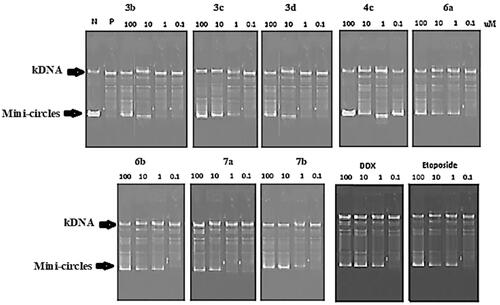
Table 2. IC50 of the tested compounds on Topo II in comparison with Etoposide and Doxorubicin.
Figure 6. In vitro cytotoxicity (IC50) of compound 4c and Doxorubicin on WI-38 human cell line (Normal cell composed of fibroblasts and derived from lung tissue of a 3-month-gestation aborted female fetus).
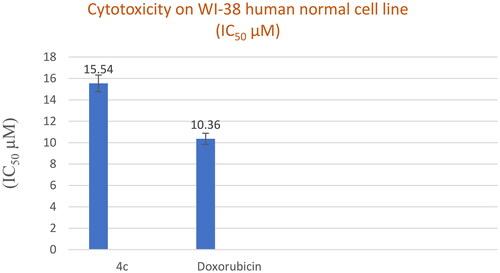
Table 3. The degree of selectivity of the tested compound 4c and Doxorubicin.
Figure 7. (A) Cell cycle analysis of A549 treated with DMSO only, (B) Cell cycle analysis of A549 after treatment with 4c for 24 h and 48 h.
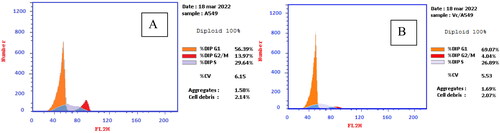
Table 4. Cell cycle analysis of A549 cells after treatment with 4c and DMSO control.
Figure 8. (A) Apoptosis and necrosis in A 549 cell line (control), (B) The effect of compound 4c on apoptosis and necrosis in A 549 cells, (C) Graphical representation of the effect on apoptosis and necrosis of 4c on A 549 cell line compared to control cells.
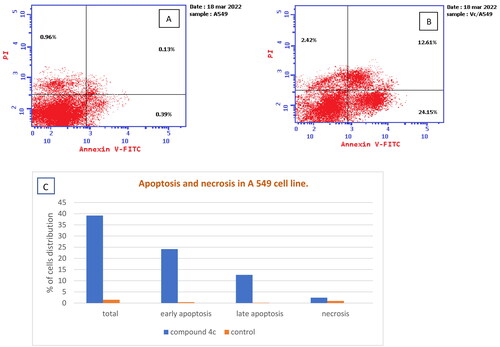
Figure 9. The (a) 3D and (b) 2D interaction mode of the ligand (Etoposide) within topoisomerase II binding pocket (PDB code 4GWK). The pink dot arrow represents H-bond.
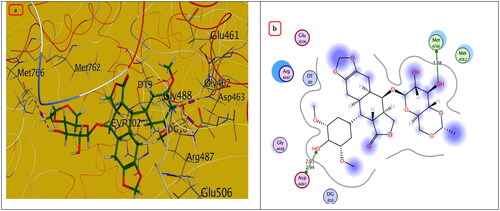
Figure 10. The (a) 3D and (b) 2D interaction mode of Doxorubicin (reference drug) within topoisomerase II binding pocket. The pink dot arrow represents H-bonds and brown dot arrow represents H-π interaction.
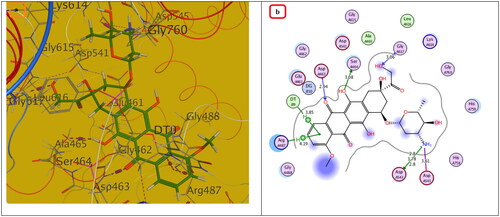
Figure 11. The (a) 3D and (b) 2D interaction mode of compounds 3b-d within topoisomerase II binding pocket. The pink dot arrow represents H-bonds and brown dot arrow represents H-π interaction.
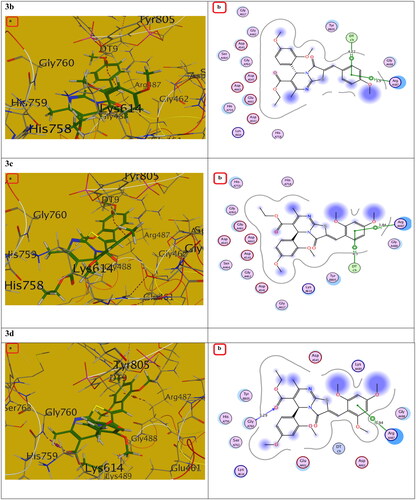
Figure 12. The (a) 3D and (b) 2D interaction mode of compound 4c and its metabolite within topoisomerase II binding pocket. The pink dot arrow represents H-bonds and brown dot arrow represents H-π interaction.
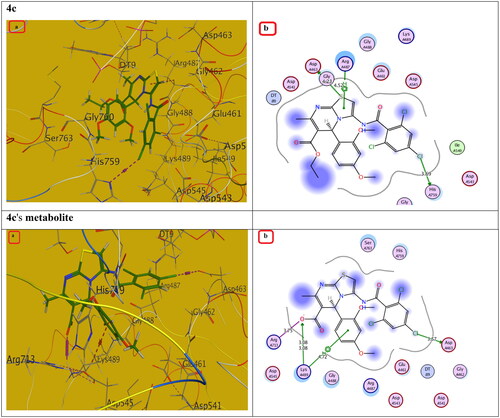
Figure 13. The (a) 3D and (b) 2D interaction mode of compounds 6a, 6b and 7a, 7b within topoisomerase II binding pocket. The pink dot arrow represents H-bonds and brown dot arrow represents H-π interaction.
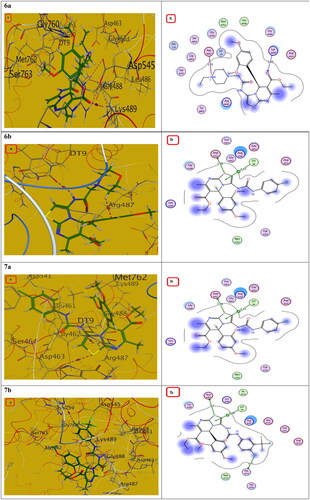
Table 5. Docking study outcomes of the selected compounds showing the binding interactions with topoisomerase II enzyme binding site.
Table 6. The in silico predicted pharmacokinetics for most active compounds compared to Doxorubicin and Etoposide.
Table 7. In silico physicochemical properties for most active compounds in comparison to doxorubicin and etoposide.
Table 8. The drug-likeness of most active compounds as well as the references Doxorubicin and Etoposide drugs.