
Figures & data
Figure 1. The worldwide requirement of preventive medication compared to the realised medication according to WHO [https://apps.who.int/neglected_diseases/ntddata/sch/sch.html, figure visualisation made by Susanna Haapanen using GraphPad Prism (1992–2020 GraphPad Software, LLC, version 9.0.0)].
![Figure 1. The worldwide requirement of preventive medication compared to the realised medication according to WHO [https://apps.who.int/neglected_diseases/ntddata/sch/sch.html, figure visualisation made by Susanna Haapanen using GraphPad Prism (1992–2020 GraphPad Software, LLC, version 9.0.0)].](/cms/asset/17027dc8-f826-4295-80c6-dfa623c78d8e/ienz_a_2184299_f0001_c.jpg)
Figure 2. Comparison of the β-CA protein sequence of this study (S_mansoni_new) by sequence alignment to homologs from three other Schistosoma species. The conserved residues of the catalytic-site motifs, CXDXR and HXXC, are indicated with black triangles (C: Cys, D: Asp, H: His, R: Arg, X: any residue). Columns with fully conserved residues are shown as red with white letters. Boxed columns denote positions in which at least 75 % of residues are of a similar type, consisting of a total of 244 aa (91.7 %), of which 175 aa are totally conserved (65.8 %). The top line indicates the secondary structures of the AlphaFold model for S. mansoni β-CA. α: α-helices; β: β-strands; η: 310-helices; T: turns.
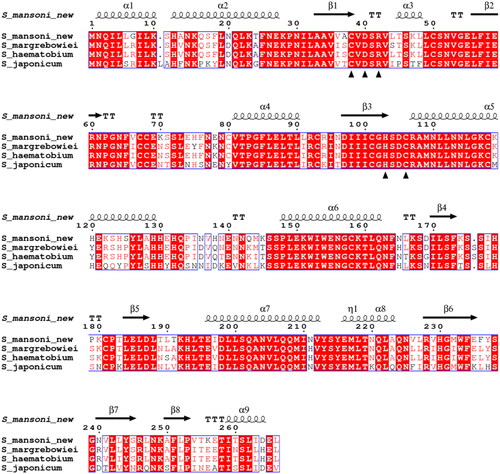
Figure 3. The coding sequence of the β-CA gene from S. mansoni. The predicted Rho-independent transcription termination site is marked in underlined blue and red text in the sequence, and the corresponding Rho-independent stem-loop is shown on the right.
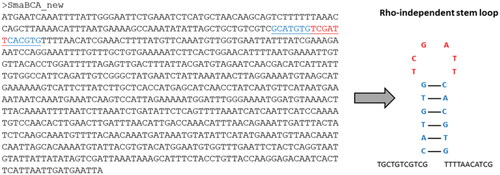
Figure 4. SDS-PAGE of β-CA of S. mansoni (SmaBCA) showing six polypeptide bands confirmed to represent SmaBCA by mass-spectrometry (data not shown). Right lane: The most intense bands of 25 and 29 kDa are the main forms of the expressed protein, and the additional polypeptides either are degraded forms (13 and 22 kDa) or oligomers (38 and 75 kDa). Left lane: Standard molecular weight (MW) markers in kDa.
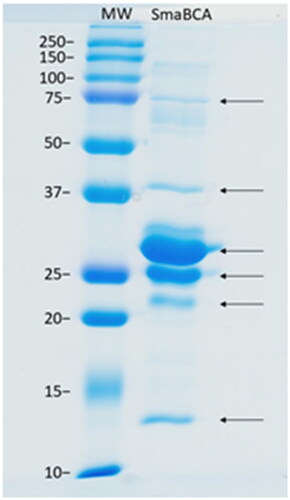
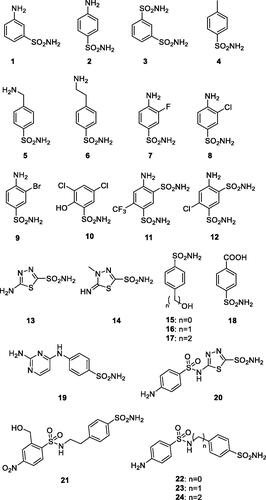
Table 1. Inhibition data for SmaBCA with sulphonamide analogs 1–24, clinically used compounds, and anions.
Figure 6. Comparison of metazoan β-CA proteins. This sequence logo represents an MSA of 162 sequences, cropped at both ends to show only the extent of the SmaBCA sequence. The height of each stack of letters represents the conservation (information content) of each column in the alignment. The width of the letters represents the number of non-gap characters in each column (i.e. very narrow letters indicate positions in which only few of the aligned proteins have any sequence).
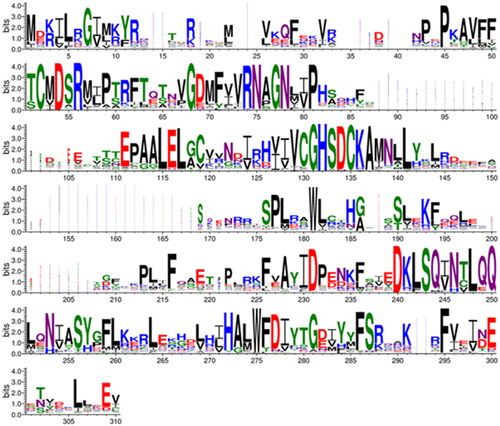
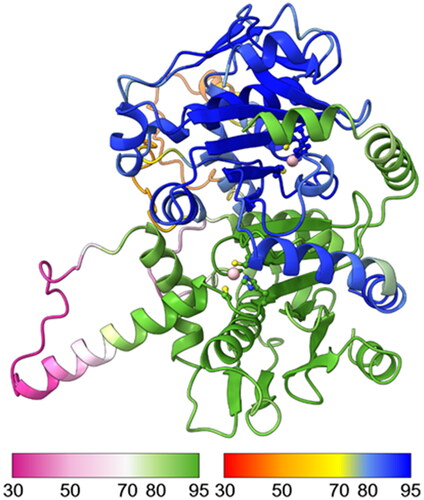
Figure 7. Molecular model of a hypothetical SmBCA dimer, constructed using AlphaFold multimer. Colouring is shown based on the per-residue confidence score (pLDDT), with two different palettes, as shown in the colour keys at the bottom left and right, for the bottom and top monomer, respectively. Metal-binding residues at the catalytic site (Cys 38, His 103, and Cys 106) are shown in balls-and-sticks style. The zinc ion at the catalytic site is displayed in pink.
Supplemental Material
Download PDF (164 KB)Data availability statement
The data that support the findings of this study are openly available in MarttiT/S.-mansoni-BCA at https://github.com/MarttiT/S.-mansoni-BCA.