Figures & data
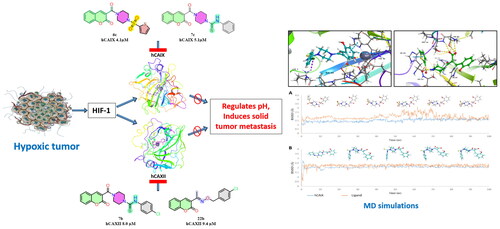
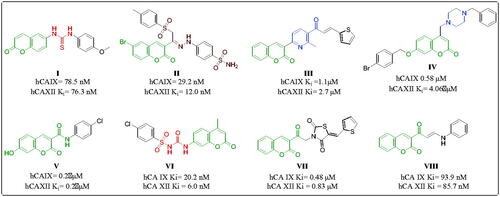
Figure 1. Carbonic anhydrase activity of previously reported coumarin derivatives.
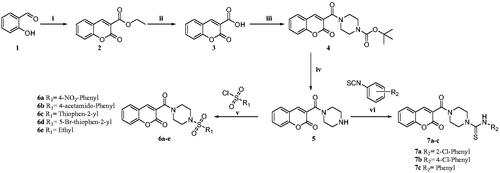
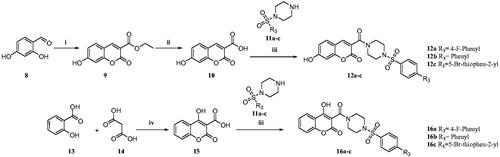
Scheme 1. Reagents and conditions: (i) diethyl malonate, Piperidine, EtOH, 70–80 °C, 4–6 h, 82% (ii) NaOH, H2O, MeOH, rt., 2 h, 74% (iii) N-Boc piperazine, EDC.HCl, HOBt, DIPEA, DMF, rt, 8-12 h, 61% (iv) TFA, DCM, 0–5 °C to rt., 1 h, 69% (v) substituted sulphonyl chlorides, DIPEA, DCM, rt., 2–3 h, 75–81%. (vi) substituted phenylisothiocyanates, ACN, reflux, 2–3 h, 65–75%.
Scheme 2. Reagents and conditions: (i) diethyl malonate, piperidine, glacial acetic acid (Cat.), reflux, 80 °C, 4–6 h, 79% (ii) NaOH, H2O, MeOH, rt.,2 h, 70% (iii) substituted sulphonyl piperazines, EDC.HCl, HOBt, DIPEA, DMF, rt,8–12 h, 60–75% (iv) TFA, 90–100 °C 8 h, 88% Citation27.
Scheme 3. Reagents and conditions: (i) ethyl acetoacetate, piperidine, EtOH, rt, 4–6 h, 70% (ii) cat. AcOH, DMF, rt, 2–3 h, 70–73%.
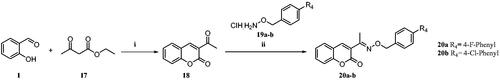
Table 1. Inhibition data for hCA isozymes I, II, IX and XII for synthesised compounds using AAZ as a standard CAI (Ki in µM).a,b
Figure 2. (A) Docking pose of compound 6c (green) (B) docking pose of compound 7c (grey) in the active site of hCA IX (PDB ID: 5DVX) Zn2+ is represented as grey sphere.
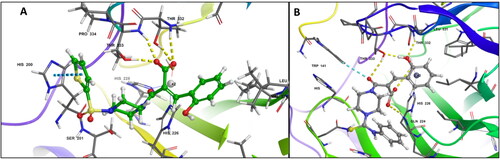
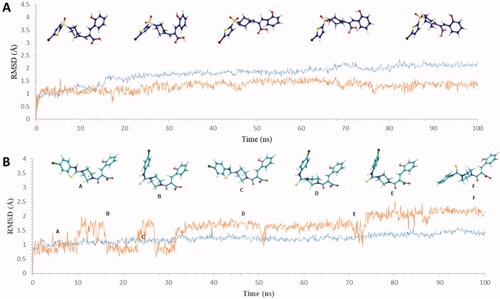
Figure 3. Graph showing analysis of ligand RMSD for MD simulation time of 100 ns on hCA IX (PDB ID: 5DVX) (A) change in conformations of 6c. (B) change in conformations of 7c.
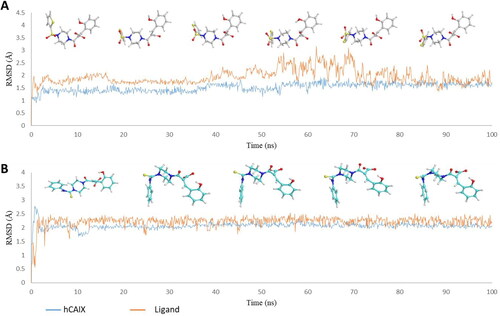
Figure 4. (A) Docking pose of compound 6d (purple) (B) docking pose of compound 7b (teal) in the active site of hCA IX (PDB ID: 1JD0) Zn2+ is represented as grey sphere.
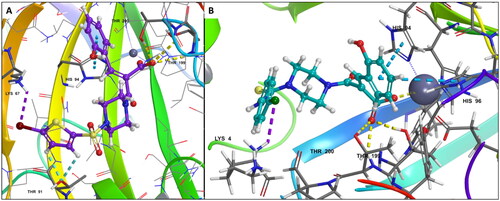
Figure 5. Graph showing analysis of ligand RMSD for MD simulation time of 100 ns on hCA XII (PDB ID: 1JD0) (A) change in conformations of 6d. (B) change in conformations of 7b.