Figures & data
Figure 1. Pharmacophoric elements for dual inhibition of c-Met/VEGFR-2 TKs.
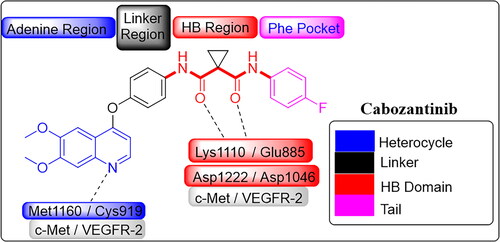
Figure 2. Four structural elements of reported dual c-Met/VEGFR-2 inhibitors.
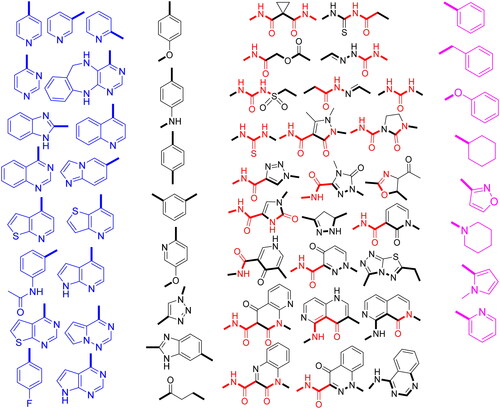
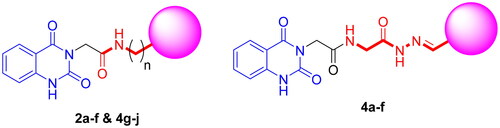
Figure 3. General structures of target compounds.
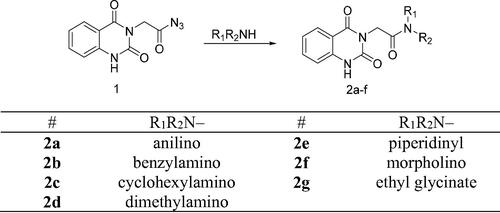
Scheme 1. Synthesis of target compounds 2a–g.
Scheme 2. Synthesis of target compounds 3 and 4a–j; reagents and conditions: (a) N2H4·H2O, EtOH, reflux. (b) Ar-CHO, piperidine, EtOH, reflux. (c) Cyclohexanone, EtOH, reflux. (d) Isatin, AcOH, reflux. (e) Acetylacetone, EtOH, reflux. (f) CS2, pyridine, reflux. (g) PhNCS, EtOH, reflux. (h) NaOH.
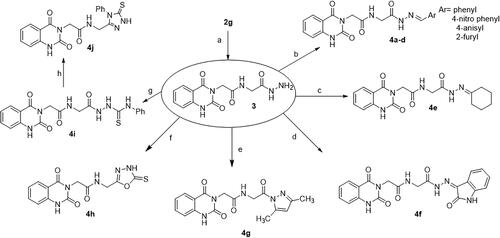
Figure 4. Suggested mechanism of reaction of acyl azide with primary and secondary amines.
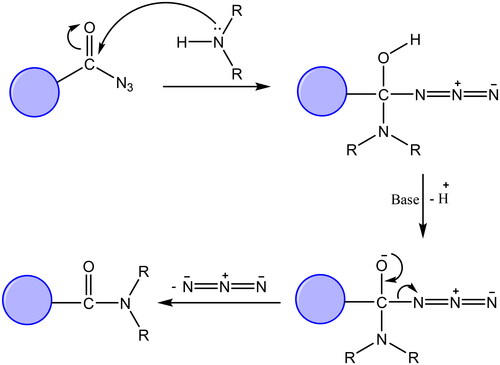
Figure 5. Isomers of N-acylhydrazones.
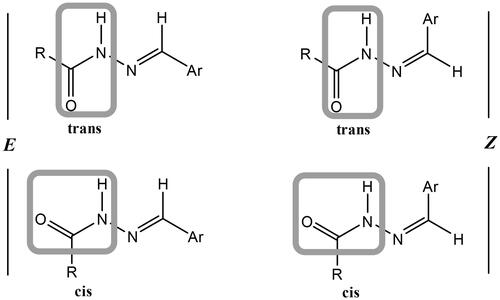
Table 1. In vitro cytotoxicity of compounds 2a–g, 3, 4a–j, and cabozantinib against HCT116 cell line.
Figure 6. Cis/trans amide conformers of hydrazone 4e.
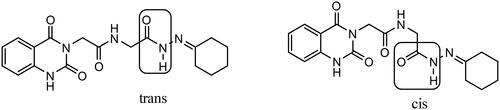
Table 2. In vitro cytotoxicity of compounds 4b and 4e against WI38 normal cell line.
Figure 7. Correlation of the inhibitory activity of c-Met enzyme and VEGFR-2 enzyme.
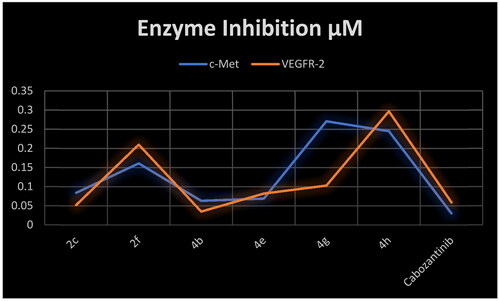
Table 3. Inhibitory activity of selected compounds against c-Met and VEGFR-2.
Figure 8. Cell cycle analysis in HCT-116 colon cancer cell line treated with compounds 4b and 4e.
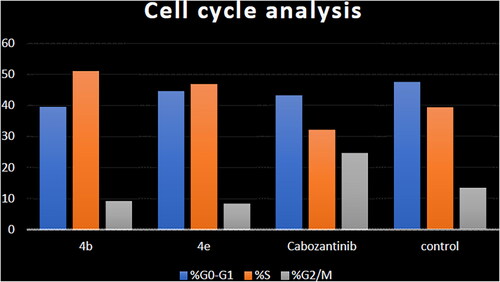
Table 4. Cell cycle analysis in HCT-116 colon cancer cell line treated with compounds 4b and 4e.
Figure 9. Apoptosis induction analysis using Annexin-V/propidium iodide (PI) staining assay.
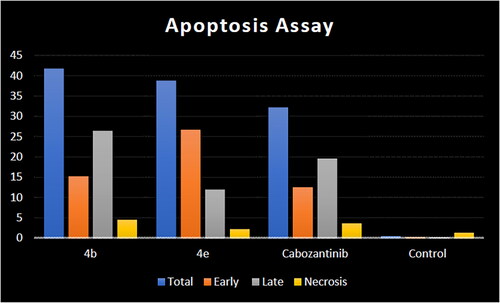
Figure 10. Representative cytograms of apoptotic HCT-116 cells induced by 4b and 4e compared to cabozantinib for 24 h.
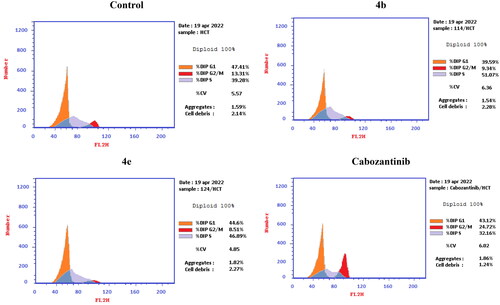
Figure 11. Representative cytograms of apoptotic HCT-116 cells induced by 4b and 4e compared to cabozantinib for 24 h.
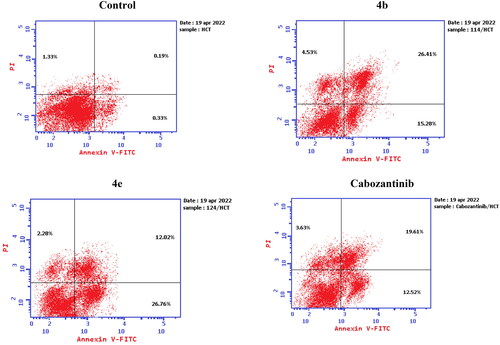
Table 5. Apoptosis induction analysis for compounds 4b, 4e, and cabozantinib.
Figure 12. Docking pose of compound 4b and 4e with c-Met TK (PDB: 3lq8).
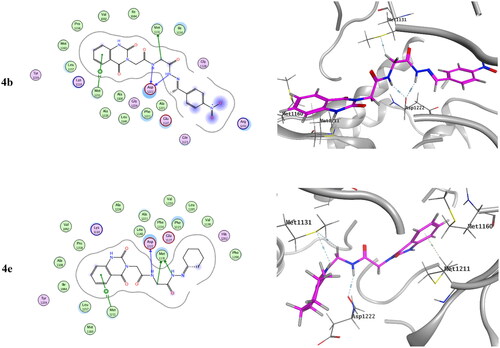
Figure 13. Docking pose of compound 4b and 4e with VEGFR-2 TK (PDB: 4asd).
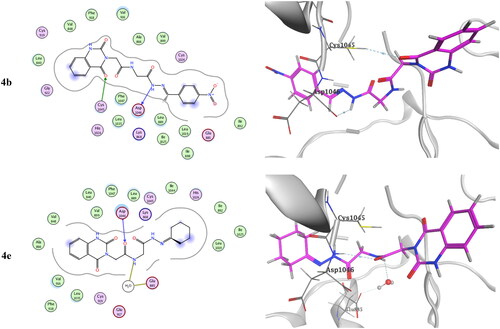
Figure 14. Bioavailability Radar for 4b, 4e, and cabozantinib.
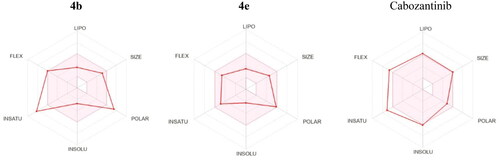
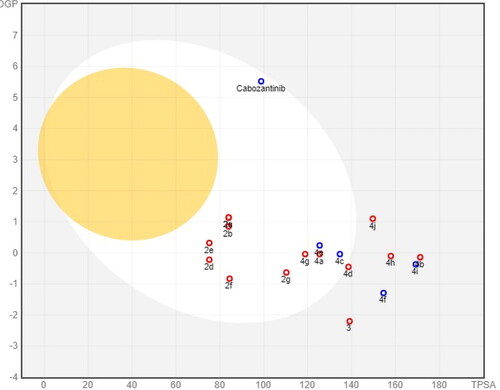
Figure 15. BOILED-Egg model of target compounds and cabozantinib.