
Figures & data
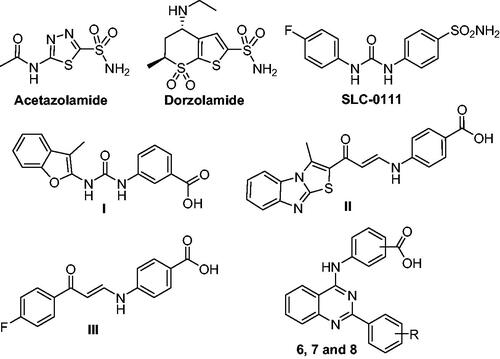
Figure 1. Structure of acetazolamide, dorzolamide, SLC-0111, non-classical CAIs (I–III), and the target inhibitors (6, 7, and 8).
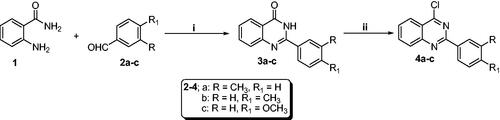
Scheme 1. Synthesis of chloroquinazolines (4a–c): Reaction conditions (i) FeCl3/H2O/heating 80 °C/3h, (ii) POCl3/N,N-dimethylformamide (cat.)/heating 90 °C/4h.
Scheme 2. Synthesis of 2-aryl-quinazolin-4-yl aminobenzoic acids (6a–c, 7a–c and 8a–c): Reaction conditions (i) Isopropanol/HCl (cat.)/reflux/2h.
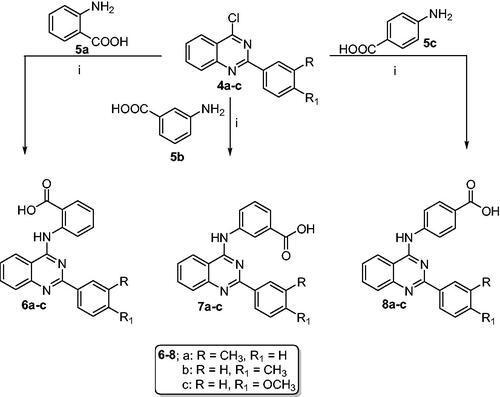
Table 1. Inhibition data of hCA isoforms I, II, IX, XII, for carboxylic acids (6a–c, 7a–c, and 8a–c) by a stopped flow CO2 hydrase assay.
Figure 2. SARs summary for the hCA inhibitory activities of target quinazolines.
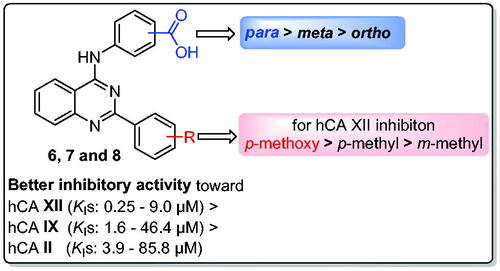
Table 2. Selectivity ratios for the inhibition of CA IX and XII isoforms over CA I and II isoforms for carboxylic acids (6a–c, 7a–c, and 8a–c) and acetazolamide.
Table 3. Percentage growth inhibition (GI%) of subpanel tumour cell lines at 10 μM concentration of the quinazoline based-carboxylic acids (6a–c, 7b, and 8a–b).
Table 4. GI50, TGI, and LC50 values of NCI five doses anticancer assay for 6b (NSC: 835857).
Table 5. Median GI50 values (µM) for compound 6b on subpanel tumour cell lines.