Figures & data
Figure 1. Structures of tested compounds.
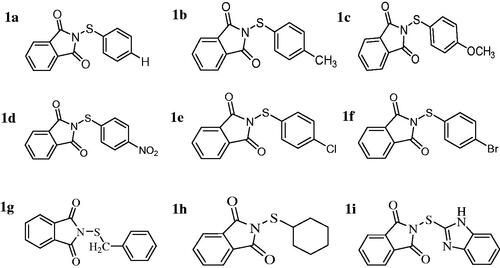
Table 1. CA enzyme inhibition data with sulfenimides (KI values).
Table 2. Pharmacokinetic properties of the compounds obtained from SwissADME database.
Figure 2. Activity %-[C14H8BrNO2S (µM) (1f)] regression analysis graph for hCA-I in the presence of five different concentrations.
![Figure 2. Activity %-[C14H8BrNO2S (µM) (1f)] regression analysis graph for hCA-I in the presence of five different concentrations.](/cms/asset/0f5bf5c4-b0dd-4771-b4aa-00502e6e4c0a/ienz_a_2194573_f0002_c.jpg)
Figure 3. Activity %-[C14H8BrNO2S (µM) (1f)] regression analysis graph for hCA-II in the presence of five different concentrations.
![Figure 3. Activity %-[C14H8BrNO2S (µM) (1f)] regression analysis graph for hCA-II in the presence of five different concentrations.](/cms/asset/5285d056-6b9d-43db-bc66-d679d06e3f36/ienz_a_2194573_f0003_c.jpg)
Figure 4. Activity %-[C14H8BrNO2S (µM) (1f)] regression analysis graph for bCA in the presence of five different concentrations.
![Figure 4. Activity %-[C14H8BrNO2S (µM) (1f)] regression analysis graph for bCA in the presence of five different concentrations.](/cms/asset/92cd85ca-553a-4c4c-a6bb-bb20f73395b1/ienz_a_2194573_f0004_c.jpg)
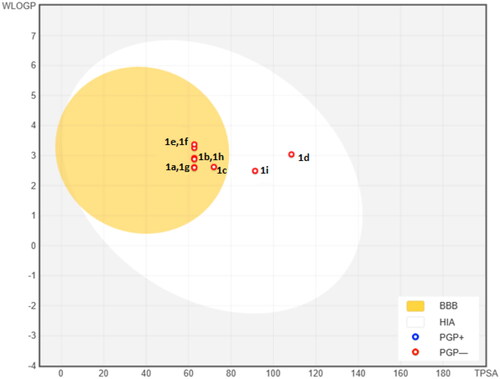
Figure 5. The BOILED-Egg predictive model for sulfenimide derivatives. The white region is the physicochemical space of molecules with highest probability of being absorbed by the gastrointestinal tract, and the yellow region is the physicochemical space of molecules with highest probability to permeate to the brain. Yolk and white areas are not mutually exclusive.