
Figures & data
Figure 1. Triplex metallohelices used in this study. Each assembly comprises three ligand strands L, colourised separately and shown inset in black for clarity. The Rc,ΔFe,HHT-[Fe2L3]4+ enantiomers shown are denoted Δ-1 and Δ-2. The mirror images Sc,ΛFe,HHT-[Fe2L3]4+ are denoted Λ-1 and Λ-2 in the text.
![Figure 1. Triplex metallohelices used in this study. Each assembly comprises three ligand strands L, colourised separately and shown inset in black for clarity. The Rc,ΔFe,HHT-[Fe2L3]4+ enantiomers shown are denoted Δ-1 and Δ-2. The mirror images Sc,ΛFe,HHT-[Fe2L3]4+ are denoted Λ-1 and Λ-2 in the text.](/cms/asset/63720e9e-3f4c-46d4-939f-a4335d2380ea/ienz_a_2198678_f0001_c.jpg)
Figure 2. DC50 values [μM] (upper panels) for DNA G4s and DNA duplex determined by FID upon the addition of metallohelices in 10 mM potassium phosphate buffer (pH 7) and increasing concentrations of KCl (total concentrations of K+ are indicated in the ). The results are expressed as mean ± SD from 2 independent experiments. Selectivity indexes (lower panels) of metallohelices towards DNA G4s in 10 mM potassium phosphate buffer (pH 7) and increasing concentrations of KCl. The values of the binding selectivity for each metallohelix were calculated as a ratio between the DC50 values obtained for the duplex and G4 DNA.
![Figure 2. DC50 values [μM] (upper panels) for DNA G4s and DNA duplex determined by FID upon the addition of metallohelices in 10 mM potassium phosphate buffer (pH 7) and increasing concentrations of KCl (total concentrations of K+ are indicated in the Figure 2). The results are expressed as mean ± SD from 2 independent experiments. Selectivity indexes (lower panels) of metallohelices towards DNA G4s in 10 mM potassium phosphate buffer (pH 7) and increasing concentrations of KCl. The values of the binding selectivity for each metallohelix were calculated as a ratio between the DC50 values obtained for the duplex and G4 DNA.](/cms/asset/59ee2efa-570c-4f6a-a6b6-8941b44a355d/ienz_a_2198678_f0002_c.jpg)
Figure 3. ΔTm values for the fluorescently labelled hTelo, c-kit1, c-kit2, c-myc, and k-ras DNA G4s (0.4 μM) determined by FRET upon addition of 0.8 μM enantiomers of 1 and 2 in the presence of increasing concentrations of dsDNA (indicated in ). The measurements were carried out in 10 mM potassium phosphate (pH 7) (upper panels) and 10 mM potassium phosphate and 30 mM KCl (pH 7) (lower panels). The results are expressed as mean ± SD from three independent experiments.
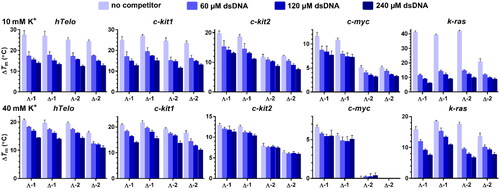
Table 1. Loss of the stabilising ability of metallohelices (0.8 µM) towards DNA G4s (0.4 µM) in the presence of 240 µM dsDNA in 10 and 40 mM K+.
Figure 4. Inhibition of Taq polymerase DNA synthesis on templates (30 nM) with c-myc, c-kit2, c-kit1, hTelo, and k-ras G4-forming sequences in the presence of increasing concentrations of metallohelices. A. Autoradiograms of 12% PAA sequencing gels with products of DNA synthesis on the template containing c-myc G4-forming sequence in the presence of increasing concentrations of the Λ- and Δ-enantiomers of 1 and 2. fp, ps, and p correspond to full-length product, pausing site by G4, and primer, respectively. B. Plots showing the ratio of the radiation corresponding to pausing sites to total radiation of the lane vs. the concentration of 1 and 2 enantiomers. The results are expressed as mean ± SD from two independent experiments.
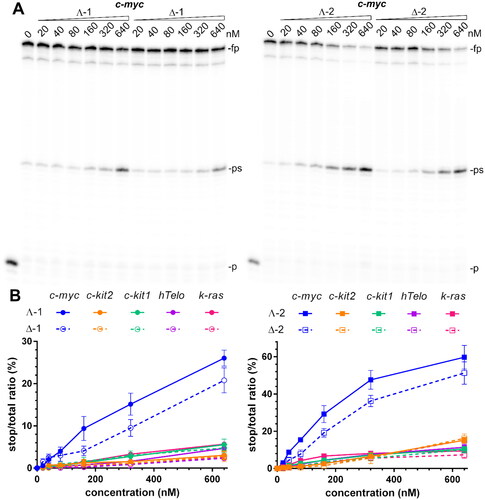
Figure 5. A. Relative expression of c-MYC and k-RAS mRNA in HCT116 cells treated with Λ- and Δ-enantiomers of 1 and 2 at concentrations corresponding to 1×, 2×, and 3 × IC50, respectively, normalised to GAPDH. B. Western blot images of c-myc, k-ras, and GAPDH levels in HCT116 cells treated with increasing concentrations (indicated above gels) of 1 and 2. C. Relative expression of c-myc and k-ras proteins normalised to GAPDH. Data represent the mean ± SD of two to four independent experiments. The stars indicate a statistically significant difference determined by the Student t-test (*p ≤ .05; **p ≤ .01; $p ≤ .001; #p ≤ .0001).
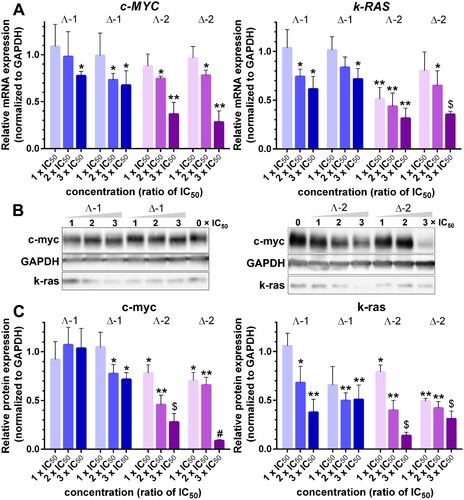
Table 2. IC50 values determined with MTT assay in HCT116 cells after a 72-h treatment.