Figures & data
Figure 1. Examples of clinically used sulphonamide-based drugs.
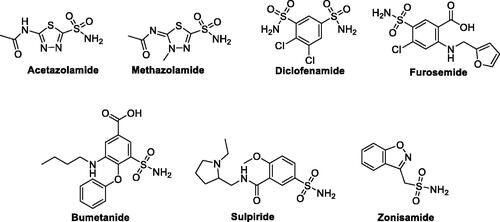
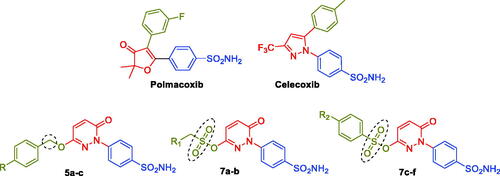
Figure 2. Chemical structures of the dual CA/COX-2 inhibitors Polmacoxib and Celecoxib, as well as the target pyridazinones 5a-c, and 7a-f.
Scheme 1. General Synthesis of pyridazine derivatives (2 and 5a-c); Reagents and conditions: (i) H2O, reflux, overnight; (ii) Potassium carbonate, DMF, stirring at 5 °C, 3 h.

Scheme 2. General Synthesis of pyridazine derivatives (7a-f); Reagents and conditions: (i) Pyridine, stirring at 5 °C, 1 h.
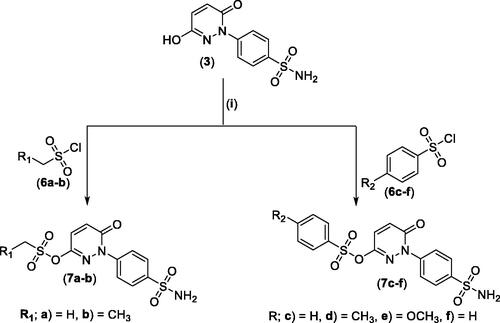
Table 1. In vitro inhibition data of hCA I, II, IX and XII with pyridazine derivatives (3, 5a-c and 7a-f) by the stopped flow kinetic assay using AAZ as a reference drug.
Table 2. IC50 values for the in vitro COX-1/2 and LOX inhibition, as well as COX SI values of the pyridazine-based sulphonamide derivatives 3, 5a-c and 7a-f.
Table 3. Inhibition data of LOX enzyme with pyridazine-based sulphonamide derivatives 3, 5a-c and 7a-f.
Table 4. Analgesic impact of the tested methanesulfonate and ethanesulfonate pyridazines 7a and 7b by the use of acetic acid writhing test in mice.
Table 5. Results of the carrageen-induced paw edoema assay that was used to investigate the effects of the pyridazine sulphonates 7a and 7b on paw height.
Figure 3. Serum level of the inflammatory mediators (TNF-α and IL-1β) after paw edoema test. The value is expressed as mean ± SD (n = 5). *Significantly different from the positive control group. A) Tumour necrosis factor – alpha (TNF-α). B) Interleukin one beta (IL-1β).
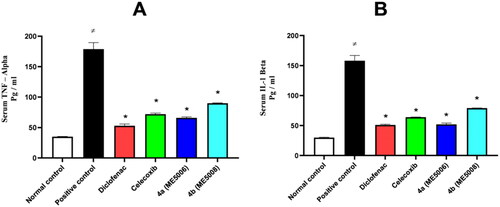
Figure 4. Ulcerogenic effects of the tested pyridazine sulphonates (7a and 7b), diclofenac and celecoxib on the gastric tissue of rats. Histopathological examination was performed using H & E stain and the magnification power of the images was 40X. The red arrows indicated the normal or damaged parts.
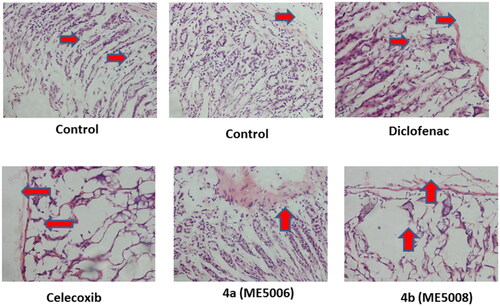
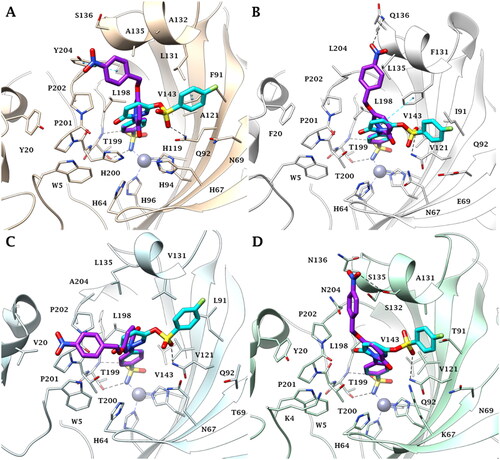
Figure 5. Predicted binding mode of 5c (purple) and 7f (cyan) within A) CA I, B) CA II, C) CA IX and D) CA XII active site.