
Figures & data
Figure 1. FDA-approved multikinase kinase inhibitors.
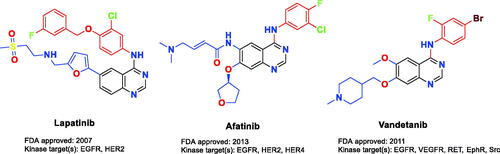
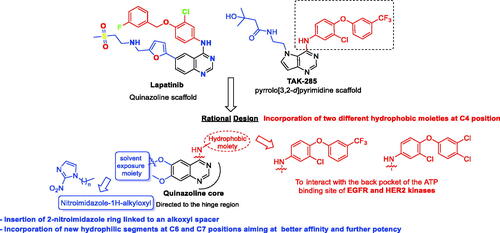
Figure 2. Rational design of the new TAK-285 derivatives 9a–h.
Scheme 1. Reagents and conditions: (i) 1,n-dibromoalkane, K2CO3, DMF, 60 °C, 4 h; (ii) 3,4-dichlorophenol, K2CO3, acetonitrile, 85 °C, 3 h; (iii) 10% Pt/C, H2 gas, methanol, rt, 18 h; (iv) aniline reagent, isopropyl alcohol, reflux, 4 h; (v) aqueous ammonia solution (28%), methanol, rt, 4 h; (vi) 1-(n-bromoalkyl)-2-nitro-1H-imidazole derivative, K2CO3, DMF, 80 °C, 4 h.
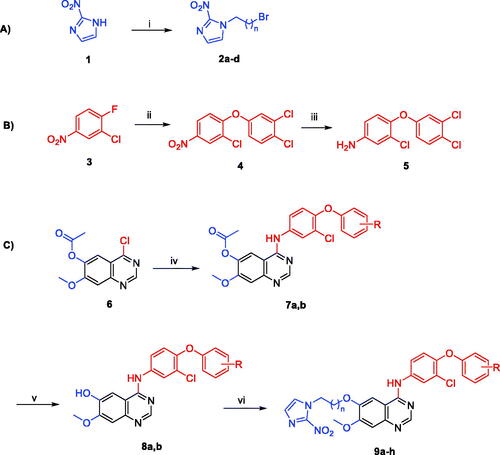
Table 1. Chemical structures and isolated yields of compounds 9a–h.
Table 2. % Inhibition results of EGFR and HER2 kinases by compounds 9a–h at 10 µM.
Table 3. IC50 values (µM) of compound 9f, staurosporine, and TAK-285 over EGFR and HER2 tyrosine kinases.
Table 4. % Inhibition of TAK-285 derivative 9f over a small kinase panel at 10 µM.
Table 5. The cytotoxic effect and IC50 value assessment of TAK-285 derivatives 9a–h against PC3 and 22RV1 prostate cancer cell lines by MTT assay.
Figure 3. The effect of compound 9f (test 2) on the phases of the cell cycle compared with control (test 1); 22RV1 cells (A) and PC3 (B).
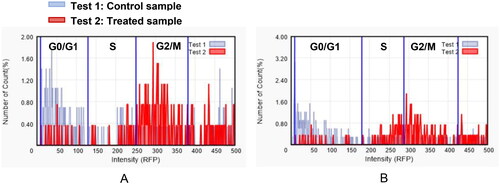
Table 6. The effect of compound 9f on the different phases of cell cycle of PC3 and 22RV1 cell lines.
Figure 4. Dot plots showing apoptosis analysis of 22RV1 cells (A, B) and PC3 (C, D) induced by compound 9f along its control.
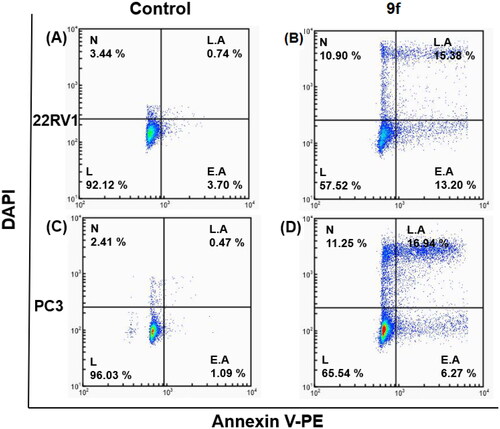
Figure 5. Cellular fluorescence images of 22RV1 cell line treated with compound 9f for 24 h. Bright-field images, fluorescence images (DAPI: 4′,6-diamidino-2-phenylindole, Annexin V PE), and merged images were assigned to the 22RV1 prostate cancer cells with control (without any compound treatment), compound 9f-treated, showing apoptotic cells.
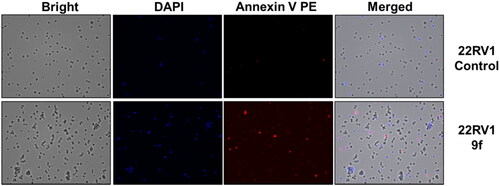
Figure 6. Cellular fluorescence images of PC3 cell line treated with compound 9f for 24 h. Bright-field images, fluorescence images (DAPI: 4′,6-diamidino-2-phenylindole, Annexin V PE), and merged images were assigned to the PC3 prostate cancer cells with control (without any compound treatment), compound 9f-treated, showing apoptotic cells.
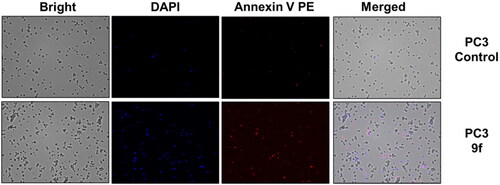
Table 7. 3D binding interactions and positioning of the docked co-crystallised AQ4 inhibitor, 9f, and 9g candidates within the EGFR (PDB ID: 1M17) binding pocket.
Table 8. 3D binding interactions and positioning of the docked co-crystallised 03P inhibitor, 9f, and 9g candidates within the HER2 (PDB ID: 3RCD) binding pocket.
Figure 7. The RMSD of 9f, 9g, and co-crystal ligand in complex with (a) 1M17 and (b) 3RCD.
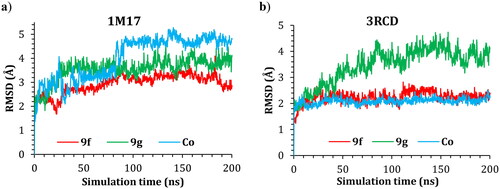
Figure 8. The GLU734–LYS851 distances in the 9g-1M17 complex during the simulations time.
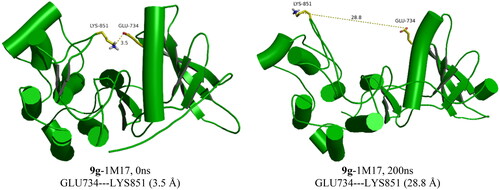
Figure 9. Plots of RMSD for ligand atoms (Å) with respect to the initial structure vs. simulation time (ns) for all the complexes.
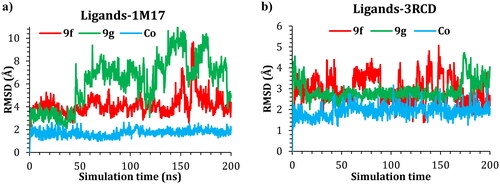
Figure 10. Snapshot of 9f-1M17 at 155 and 170 ns of simulation time showing the moving of the imidazole group out of the active site at 155 ns.
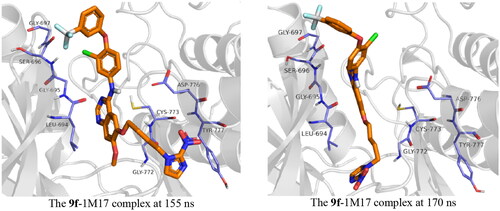
Figure 11. The histogram of 9f-1M17 contact throughout the trajectory.
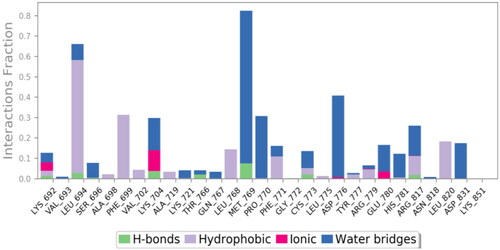
Figure 12. Compound 9f water bridge H-bond interactions with Met769 residue in 1M17.
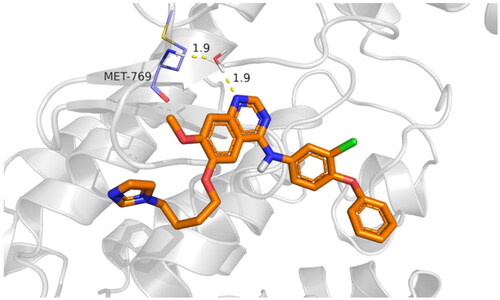
Figure 13. The histogram of 9g-3RCD contact throughout the trajectory.
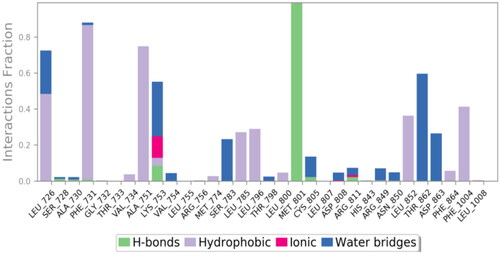
Figure 14. Compound 9g H-bond interactions with 3RCD residues.
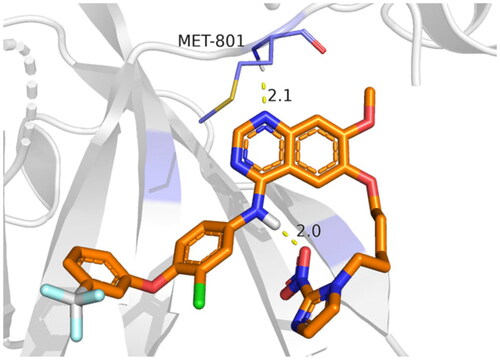
Table 9. Prime MM-GBSA energies for ligands binding at the active sites of EGFR (1M17) and HER2 (3RCD) receptors.