
Figures & data
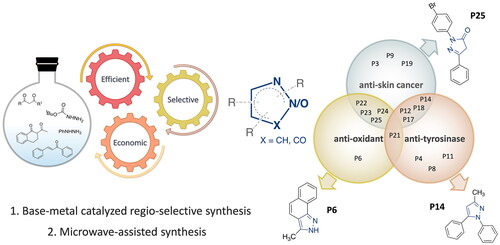
Figure 1. Molecular structures of previously reported antioxidant, antityrosinase, and anticancer compounds incorporating pyrazole or pyrazolone substructures.
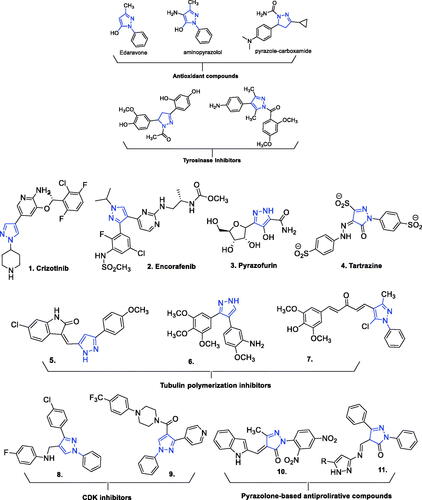
Figure 2. Structural design of biologically relevant substituted azoles and the proposed activity studies.
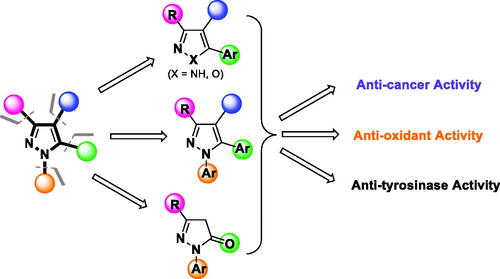
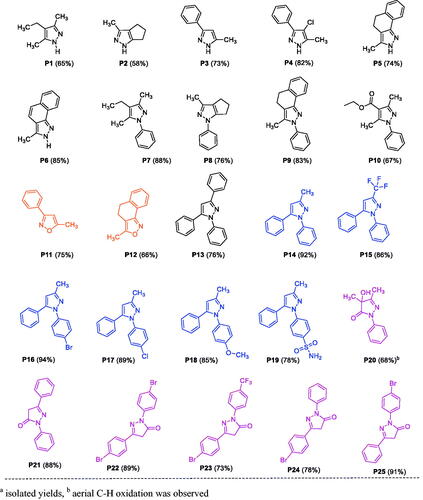
Figure 3. List of substituted pyrazole, isoxazole, and pyrazolone derivativesa. aIsolated yields and baerial C–H oxidation was observed.
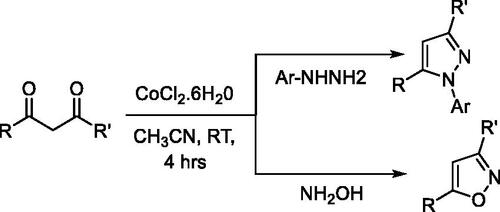
Scheme 1. Co-catalysed synthesis of pyrazoles and isoxazoles.
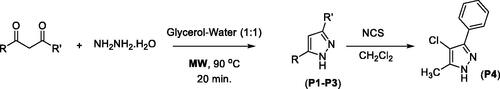
Scheme 2. Microwave-assisted synthesis of pyrazoles.
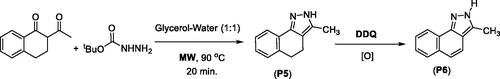
Scheme 3. Microwave-assisted synthesis of tricyclic pyrazole P5 and benznidazole P6.
Scheme 4. Synthesis of 1,3,5-triphenylpyrazoline from chalcone.
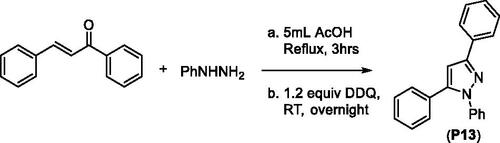
Figure 4. The mushroom tyrosinase inhibition screen of pyrazoles, pyrazolones, and isoxazoles P1–P25 identified several relatively active tyrosinase inhibitors (P4, P8, P11, P12, P14, P17, P18, and P21). (A) Initial single-concentration tyrosinase inhibition screening for derivatives P1–P25, with arbutin as a positive control. Ten compounds at a fixed concentration of 500 µM showed comparable or better percentage activity than arbutin. Data are expressed as mean ± SD from at least six independent experiments performed in triplicate. (B) Response vs. concentration curves for the above-listed potent pyrazole and pyrazolone compounds, with calculated 50% inhibitory activity (IC50) values. Data are expressed as mean ± SD from at least six independent experiments performed in quadruplicate.
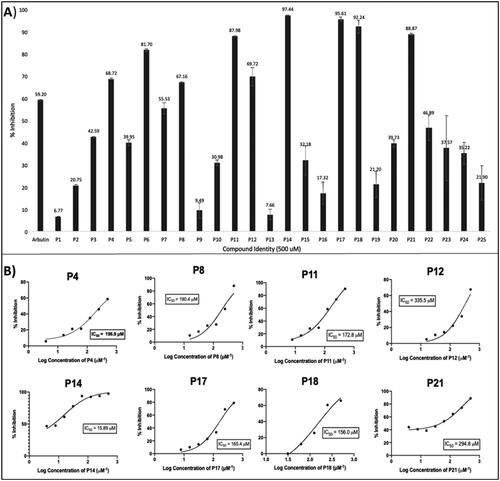
Figure 5. Docking interactions and poses between compounds (P4, P8, P11, P12, P14, P17, P18, P21, P25, and kojic acid) and the target mushroom tyrosinase protein structure adopted from PDB 2Y9X. The target protein is highlighted in line format with light grey colour (A, B). The key interacting binding site amino acids are shown in black colour, while several hydrogen bonds are observed between functional groups of particular compounds and the enzyme amino acids, as summarised in , with interaction distances ranging from 2.16 Å to 3.26 Å. Left: Ligands in line and stick representation. Right: Ligands in ball and stick representation. Binding positions are proximal to the two copper ions (Cu2+) (not shown) in the active site.
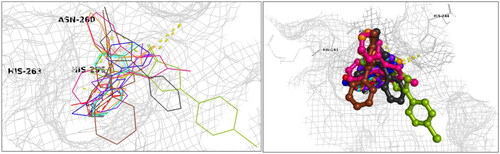
Table 1. Docking interaction energies for the active tyrosinase inhibitory compounds.
Table 2. Cytotoxicity of pyrazole (celecoxib analogs), isoxazole, pyrazolone, and positive control compounds P1–P25 (structures, ) against cells of human cutaneous melanoma and non-melanoma skin cancer lines relative to standard control noncancerous immortalised HaCaT cells.
Figure 6. The potent broad-spectrum anticancer hit compound P25 significantly inhibits colony formation capacity in A431 (A) and SK-MEL-28 (B) cells after 14 days. The percentage decrease in colony formation was concentration-dependent (0, ½IC50, IC50, and 1½IC50 obtained from the antiproliferation assay) and was comparable in A431 (C, D) and SK-MEL-28 (E, F) cells. The data expressed in the bar graphs represent the mean ± SD in the P25-treated group expressed as a percentage relative to the untreated control group. Data are from three independent experiments performed in quadruplicate. Statistical significance was assessed using one-way ANOVA and Tukey’s multiple comparison tests; **p < 0.01, and ***p < 0.001 were considered significant.
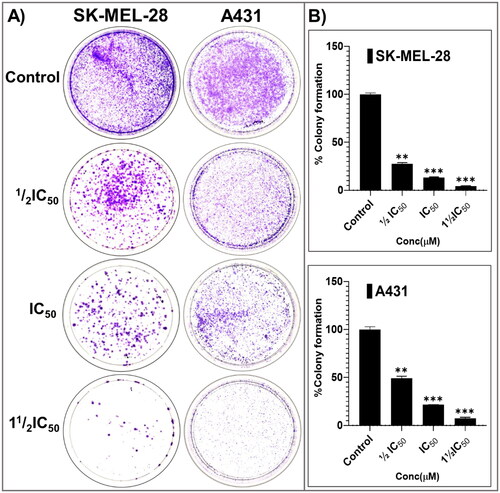
Figure 7. The screening hit compound P25 potently and dose-dependently (0, ½IC50, IC50, and 1½IC50) inhibits the migration of A431 (A; top panel) and SKMEL-28 (A; bottom panel) cells into the cell-free scratched-wounded areas of a confluent cell monolayer. This suppression of A431 and SKMEL-28 cells scratch wound closure in a concentration-dependent manner was significant. The bar graphs (B) represent the mean ± SD of covered scratch-wound area values (expressed as the migrated distance from 0-time point of scratch) after 48 h. They are expressed as a percentage of wound area at 0 h filled by migrated cells by the end of the experiment, vs. the same indicator for untreated control cells, from three independent experiments conducted in triplicate. Statistical significance was assessed using one-way ANOVA and Tukey’s multiple comparison tests; **p < 0.01, and ***p < 0.001 were considered significant.
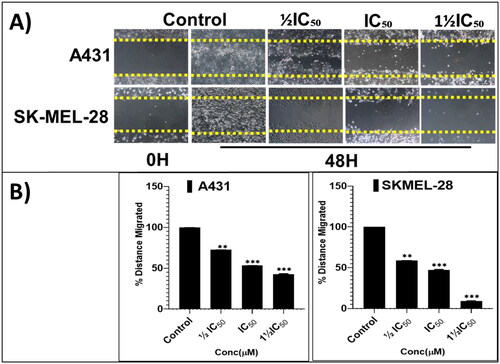
Figure 8. Compound P25 induces apoptosis by activating the extrinsic and intrinsic apoptotic pathways in cutaneous melanoma (SK-Mel-28) and non-melanoma (A431) cancer cells in culture. The blots (left) document a concentration-dependent effect (0, ½IC50, IC50, and 1½IC50; IC50 refers to the cell viability result, cf. ) of protein expression levels of markers of apoptosis, including pro- and cleaved caspase-3, and caspase-9, and of cleaved PARP, after 48 h of treatment. The data shown are representative immunoblots from three independent experiments with similar results. β-actin was used as a loading control. At right, protein levels as normalised (mean ± SD of relative quantitative density values) are expressed as a percent increase or decrease vs. untreated cells (control) in the bar graphs. Statistical significance was assessed using one-way ANOVA and Bonferroni’s multiple comparison tests; *p < 0.05 and **p < 0.01, were considered significant.
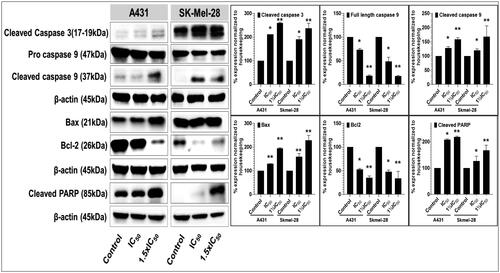
Figure 9. The 2,2-diphenyl-1-picrylhydrazyl (DPPH) anti-oxidant (radical scavenging) activity of compounds P1–P25 identifies modest to moderately potent antioxidant activity of one tricyclic pyrazole (a naphtho[1,2-c] pyrazole) and several pyrazolones. (A) Concentration-dependent radical scavenging activities, compared to quercetin as a positive control. (B) IC50 values for appreciably active compounds. Data are expressed as mean ± SD from at least six independent experiments performed in quadruplicate.
![Figure 9. The 2,2-diphenyl-1-picrylhydrazyl (DPPH) anti-oxidant (radical scavenging) activity of compounds P1–P25 identifies modest to moderately potent antioxidant activity of one tricyclic pyrazole (a naphtho[1,2-c] pyrazole) and several pyrazolones. (A) Concentration-dependent radical scavenging activities, compared to quercetin as a positive control. (B) IC50 values for appreciably active compounds. Data are expressed as mean ± SD from at least six independent experiments performed in quadruplicate.](/cms/asset/cf94aab0-d3ff-4bc6-ade5-6b25a878c4b7/ienz_a_2205042_f0009_c.jpg)
Table 3. Predicted binding energies of compounds to molecular targets, as compared to their crystal-structure-native and commercial ligands. The bold values are the significant binding affinities.
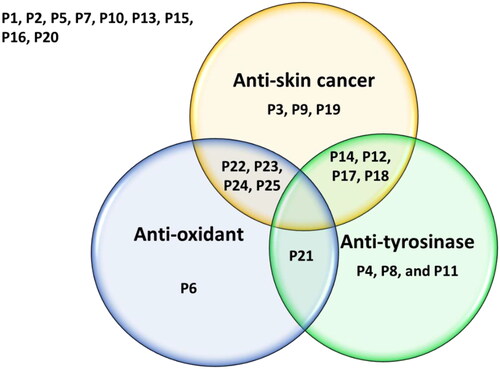
Figure 10. The Venn diagram summarises the anti-proliferative (anti-skin cancer), antioxidant, and tyrosinase inhibitory effects of the 25 compounds. Dual-acting compounds were identified with noteworthy anti-proliferative and antioxidant activity (P22, P23, P24, and P25); anti-proliferative and anti-tyrosinase activity (P12, P14, P17, and P18); and antioxidant and anti-tyrosinase activity (P21). Some tested compounds exhibited only a single noteworthy activity: antioxidant (P6); anti-tyrosinase (P4, P8, and P19), and/or anti-skin-cancer (P3, P9, and P19).
Supplemental Material
Download PDF (5.3 MB)Data availability statement
The data presented in this study are available at reasonable request from the corresponding authors.