Figures & data
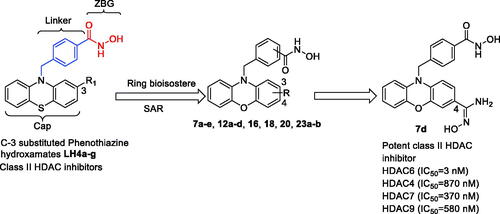
Scheme 1. Design of potent class II HDAC inhibitor 7d from investigating structure-activity relationship (SAR) of phenothiazine-based hydroxamates
Scheme 2. Reagents and conditions: (a) NaH, DMF, 0 °C, 72 h; (b) NMP, toluene, 180 °C; (c) NaH, DMF, RT; (d) i) THF-MeOH, 0 °C; ii) 50%NH2OH(aq), NaOH, RT; (e) KOH, DMSO, 110 °C, 25 h.
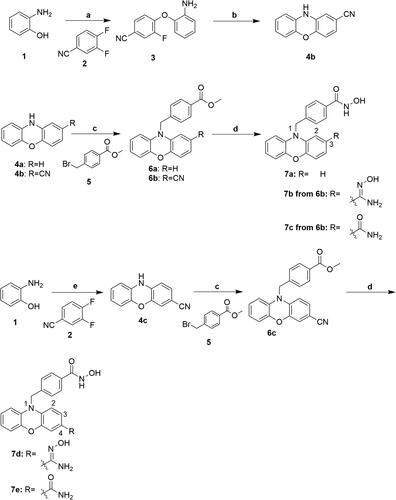
Scheme 3. Reagents and conditions: (a) 12 N HCl(aq), AcOH, Δ; (b) EDC, DMAP, DCM, RT; (c) NaH, DMF, RT; (d) i) TH MeOH, 0 °C; ii) 50%NH2OH(aq), NaOH, RT.
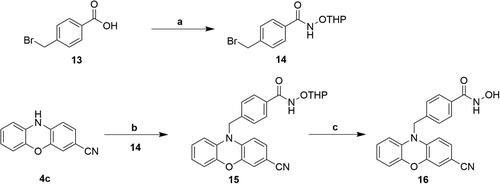
Scheme 4. Reagents and conditions: (a) i) (COCl)2, DMF, CH2Cl2, RT; ii) NH2OTHP, Et3N, CH2Cl2, RT; (b) NaH, DMF, RT. (c)1.25 N HCl-MeOH, RT.
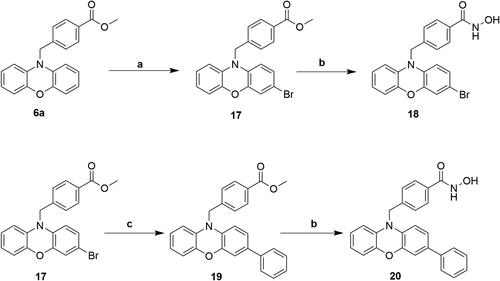
Scheme 5. Reagents and conditions: (a) NBS, THF, -20 °C; (b) i) THF-MeOH, 0 °C ; ii) 50%NH2OH(aq), NaOH, RT; (c) Pd(PPh3)4, K2CO3, THF, EtOH, H2O, N2, Δ.
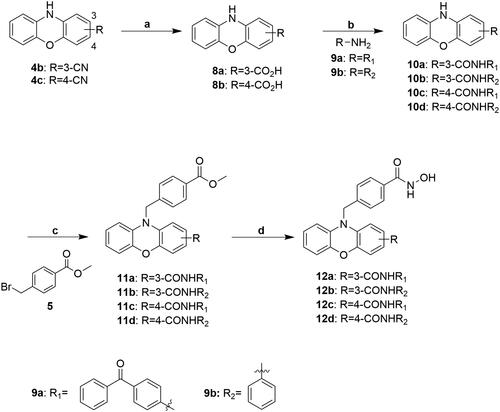
Scheme 6. Reagents and conditions: (a) NaH, DMF, RT; (b) i) THF-MeOH, 0 °C ; ii) 50%NH2OH(aq), NaOH, RT
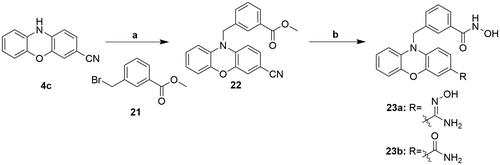
Table 1. IC50a values (μM) of enzyme inhibition of compounds 7a-e, 12a-d, 16, 18, 20, and 23a-b against class I, class IIa and class IIb HDACs.
Figure 1. Interactions analysis of compounds 7b and 7d in HDAC7 binding site. (A) Docking pose of compounds (A) 7d (blue-green) and (B) 7b (yellow) in HDAC7 (light pink). (C) Superimposed docking poses of compounds 7b and 7d in HDAC7. (D) The surface model of the superimposed docking poses for compounds 7b and 7d. The zinc ions are denoted as grey sphere. Chelating bonds are represented by red dash lines, while green dash lines indicate hydrogen bonds. Figures are created using PyMOL.
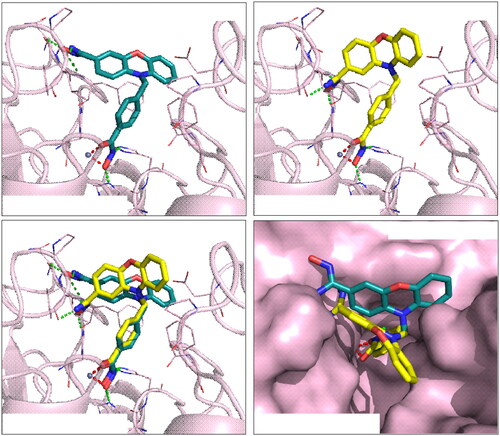
Figure 2. Interactions analysis of compounds 7b and 7d in HDAC6 binding site. (A) Docking pose of compounds 7d (blue-green) in HDAC6 (light blue). (B) Superimposed docking poses of compounds 7b (yellow) and 7d in HDAC6. The zinc ions are denoted as grey sphere. Chelating bonds are represented by red dash lines, while green dash lines indicate hydrogen bonds. Figures are created using PyMOL.
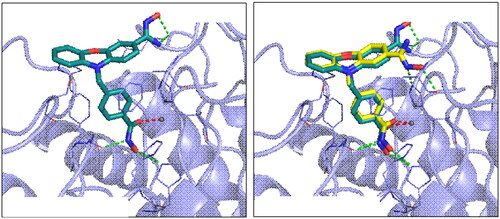
Figure 3. Effect of compound 7d and SAHA on viability of human neuroblastoma SH-SY5Y cells, as determined by alamar blue assay. All data are provided from three experiments, and each comprised six replicates. *p < 0.05, **p < 0.01, ***p < 0.001 vs control. Statistical analysis was performed using one way ANOVA, followed by a Bonferroni test.
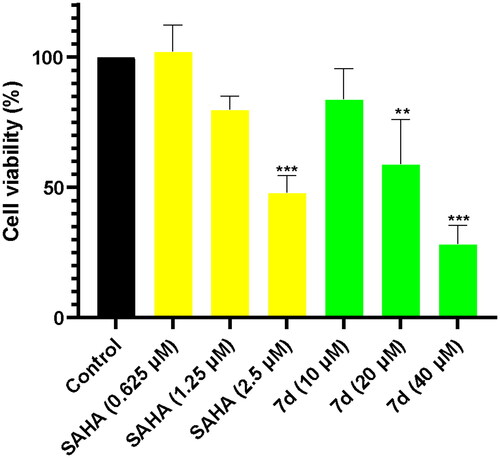
Figure 4. Compound 7d and SAHA induce histone H3 and tubulin acetylation in human neuroblastoma SH-SY5Y cells. SH-SY5Y cells were incubated with various concentrations of compound 7d and SAHA for 24 h.
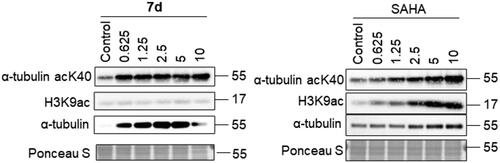
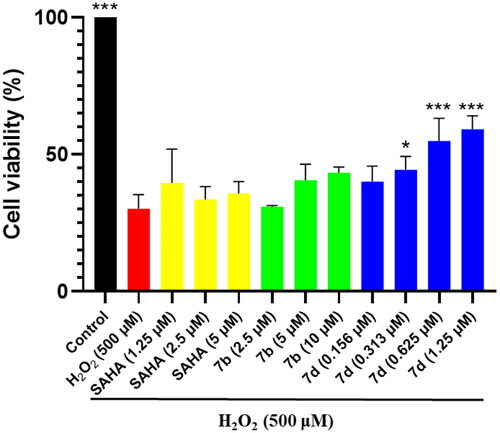
Figure 5. Protection by compounds 7b, 7d and SAHA against H2O2-induced cytotoxicity in human neuroblastoma SH-SY5Y cells as determined by MTT assay. Compounds are tested at various concentrations and cell injury is induced by H2O2 (500 μM) in human neuroblastoma SH-SY5Y cells. All data are obtained from three experiments. *p < 0.05, **p < 0.01, ***p < 0.001 vs. H2O2.