Figures & data
Figure 1. Anti-SARS-CoV-2 mechanism of S-RBD/NRP1 dual-targeting inhibitors.
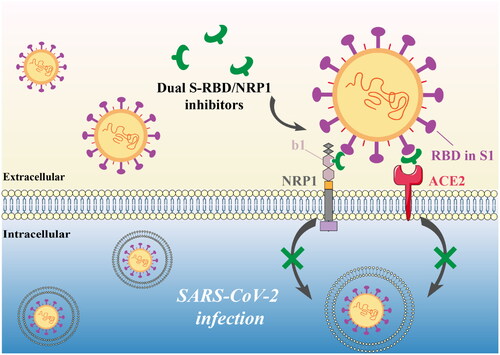
Figure 2. (A) Pharmacophore model of S-RBD. The residues in active site of S-RBD were presented as sticks with atoms coloured carbon-green, oxygen-red, and nitrogen-blue. (B) Workflow of the multistep computer-aided screening of dual S-RBD/NRP1-targeting peptides. (C) Identification of five peptides with lower S-RBD-binding energies and NRP1-BD-binding energies. (D) Sequences and properties of RNs 1–5. Binding affinity of RNs 1–5 to S-RBD and NRP1-BD. Results shown represented the mean ± SD (n = 3). The N-terminus of RNs 1 − 5 was acetylated.
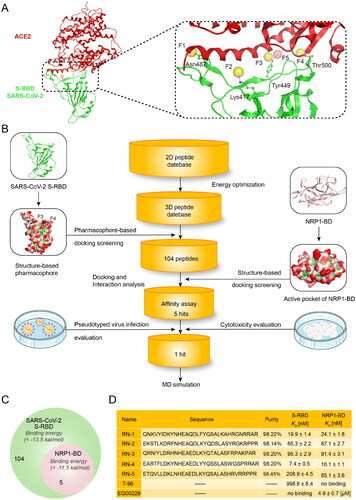
Figure 3. (A–E) Probable binding models of RNs 1–5 with S-RBD. Residues in S-RBD were presented as sticks with carbon atoms colour-coded by green, nitrogen atoms colour-coded by blue, and oxygen atoms colour-coded by red. (F-J) Probable binding models of RNs 1–5 with NRP1-BD. Residues in NRP1-BD were presented as sticks with carbon atoms colour-coded by light pink, nitrogen atoms colour-coded by blue, and oxygen atoms colour-coded by red. The RNs 1–5 were presented as sticks with nitrogen atoms colour-coded by blue, oxygen atoms colour-coded by red, and carbon atoms colour-coded by yellow, red, orange, cyan, and dark blue, respectively. The hydrogen-bond interactions were presented by purple dotted lines.
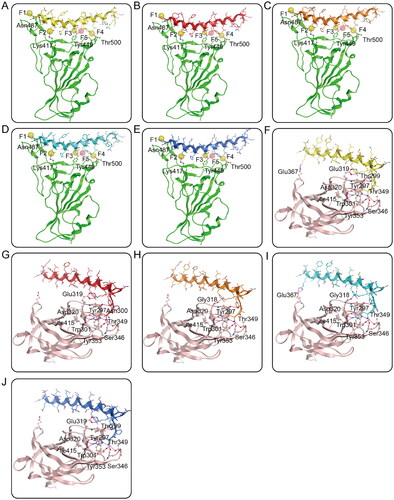
Figure 4. Infection assay of the screened peptides RNs 1–5 against pseudotyped SARS-CoV-2. (A) Infection rate of the pseudotyped SARS-CoV-2 in the presence of RNs 1–5, EG00229, and T-96 at a concentration of 3.2 μM. *p < 0.05, **p < 0.01 versus EG00229. (B-H) Dose-dependent (0–25.6 μM) assay of RNs 1–5, EG00229, and T-96. *p < 0.05, **p < 0.01, ***p < 0.001 versus control. (I-K) Effects of RN-4 on cell viability. A549, FHs 74 Int, and AC16 were incubated with RN-4 (0, 5, 10, 20, 40, and 80 μM, respectively) for 48 h. Data are presented as mean ± SD (n = 3).
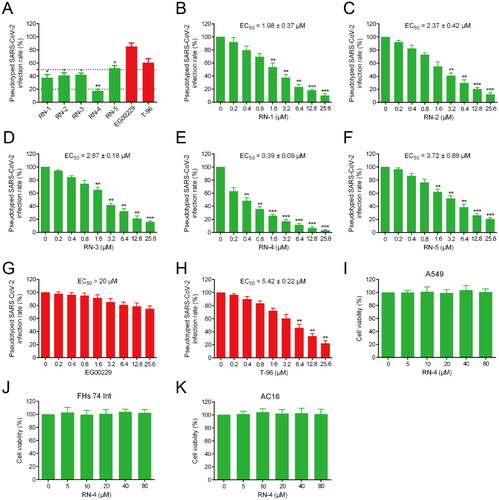
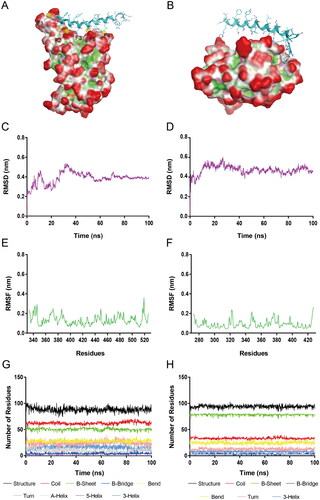
Figure 5. (A) The S-RBD-RN-4 complex for MD simulations. (B) The NRP1-BD-RN-4 complex for MD simulations. (C) RMSD of all atoms in the S-RBD-RN-4 complex. (D) RMSD of all atoms in the NRP1-BD-RN-4 complex. (E) RMSF of S-RBD backbone (Cα) atoms in the S-RBD-RN-4 complex. (F) RMSF of NRP1-BD backbone (Cα) atoms in the NRP1-BD-RN-4 complex. (G) Secondary structure of S-RBD in the S-RBD-RN-4 complex. (H) Secondary structure of NRP1-BD in the NRP1-BD-RN-4 complex.