
Figures & data
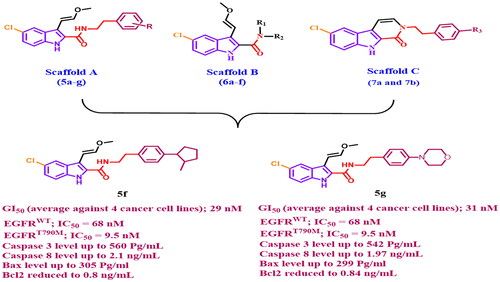
Figure 1. Structures of indole-based EGFR inhibitors I-VI.
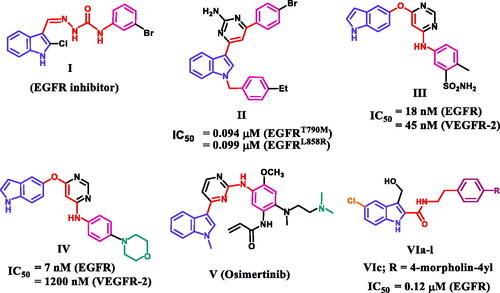
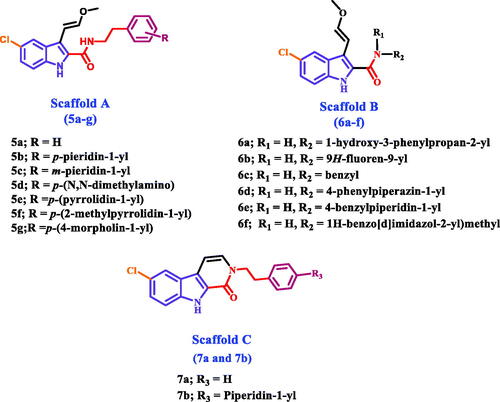
Figure 2. Structures of new targets 5a-g, 6a-f, 7a, and 7b.
Scheme 1. Synthesis of compounds 5a-g, 6a-f, 7a, and 7b. Reagents and conditions: (a) NaH, (Boc)2O, DMF, 0 °C to rt, overnight, 79%; (b) CH3OCH2P+(C6H5)3Cl-, t-BuOK, THF, 0 °C to rt, overnight, 76%; (c) 5% NaOH, EtOH, 40 °C, 93%; (d) Amine, BOP, DIPEA, DCM, rt, overnight; (e) PTSA, toluene, reflux, overnight.
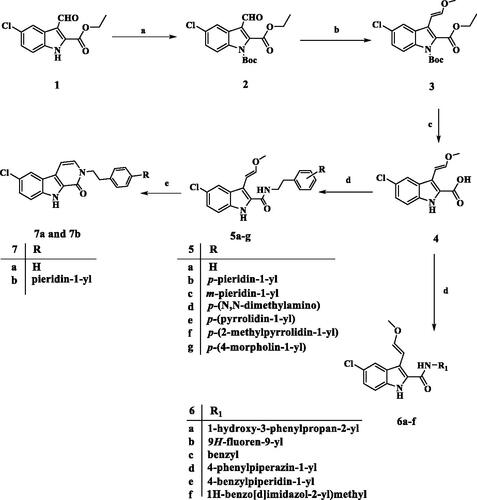
Table 1. IC50 of compounds 5a-g, 6a-f, 7a, and 7b against four cancer cell lines.
Table 2. IC50 of compounds 5c, 5d, 5f, 5 g, 6e, and 6f against EGFRWT and EGFRT790M.
Table 3. Caspase-3 level for compounds 5f, 5 g, and staurosporine in human pancreatic cancer cell line (Panc-1).
Table 4. Caspase-8, Bax and Bcl-2 levels for compounds 5f, 5 g and staurosporine on human pancreatic cancer cell line (Panc-1).
Figure 3. Docking representation models for compounds 5f and 5 g; (A) 3D-docked models of compound 5f (green) aligned with 5 g (purple) within the active site of EGFRWT showing the interaction surface of the protein (electrostatics; green: hydrophobic, blue; positive and red: negative); (B) 2D-docked model of compound 5f within the active site of EGFRWT; (C) 3D-docked models of compound 5f (green) aligned with 5 g (purple) within the active site of EGFRT790M showing the interaction surface of the protein (electrostatics; green: hydrophobic, blue; positive and red: negative); (D) 2D-docked model of compound 5f within the active site of EGFRT790M.
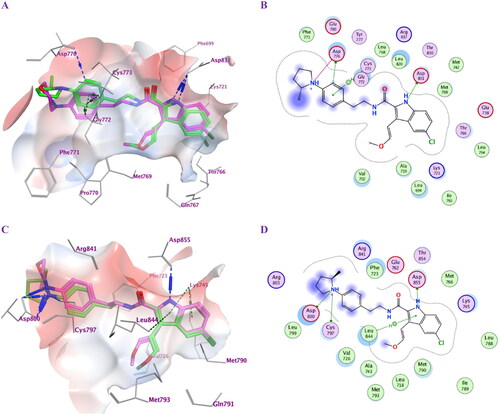
Table 5. Ligand-protein complex interactions of the tested compounds 5c, 5d, 5f, 5 g, 6e and 6f within the active site of EGFRWT.
Table 6. Ligand-protein complex interactions of the tested compounds 5f and 5 g within the active site of EGFRT790M.
Table 7. Physicochemical and pharmacokinetic properties (Lipinski parameters) of compounds 5f and 5 g.
Table 8. ADME properties of compounds 5f and 5 g.