
Figures & data
Figure 1. Structures of the pterin-based RTA inhibitors with peptide pendants.
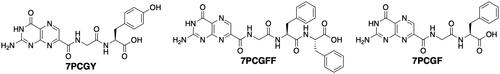
Table 1. Data collection, processing, and refinement statisticsTable Footnote†.
Figure 2. Synthesis of N-(pterin-7-carbonyl)glycyl-L-tyrosine (7PCGY).
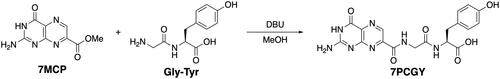
Figure 3. X-ray crystal structures of ricin toxin A chain (RTA) with or without the pterin-based inhibitors. (A) Omit map for bound N-(pterin-7-carbonyl)glycyl-L-tyrosine (7PCGY). Fo–Fc electron density (shown with black baskets) contoured to 2σ showing evidence for 7PCGY bound to this region. The omit map was generated by removing the ligand from the structure. This image was created using PyMOLCitation27. (B) Surface representation of the 7PCGY/RTA complex. The RTA surface is shown as an atomic charge map. (C) The interactions of 7PCGY in the catalytic primary pocket of RTA observed in the crystal structure of the 7PCGY/RTA complex. Conventional hydrogen bonds are represented as cyan dashed lines, hydrogen bonds between CH and carbonyl oxygen are represented as yellow dashed lines and aromatic (π-π and T-shaped) interactions are represented as magenta dashed lines. (D) Superimposition of protein crystal structures of 7PCGY/RTA (grey) and a ligand-free RTA (PDBID: 1RTC, orange). (E) X-ray crystal structure of the 7PCGF/RTA complex (PDBID: 4HUO). Conventional hydrogen bonds are represented as cyan dashed lines, hydrogen bonds between CH and carbonyl oxygen are represented as yellow dashed lines and aromatic (π-π and T-shaped) interactions are represented as magenta dashed lines. (F) A comparison of crystal structures of 7PCGY/RTA and 7PCGF/RTA. The protein portion of 7PCGY/RTA is shown in grey and that of 7PCGF/RTA in medium blue. All image creations, except (A), and interaction detections were performed using the Discovery Studio VisualiserCitation28.
Table 2. Interactions between pterin-based inhibitors and RTA.